Section Abstract Introduction Methods Results Discussion Conflict of Interest Acknowledgment References
Basic Medical R esearch
Expression and specific activities of carbamoyl phosphate synthetase 1 in chronic hypoxic rats
pISSN: 0853-1773 • eISSN: 2252-8083
http://dx.doi.org/10.13181/mji.v25i1.1213 Med J Indones. 2016;25:3–9
Received: February 27, 2015
Accepted: January 13, 2016
Author affiliation:
1 Biomedical Sciences Graduate Program, Faculty of Medicine, Universitas Indonesia, Jakarta, Indonesia
2 National Institute of Health Research and Development, Ministry of Health, Republic of Indonesia, Jakarta, Indonesia
3 Department of Biochemistry and Biology Molecular, Faculty of Medicine, Universitas Indonesia, Jakarta, Indonesia
4 Center of Hypoxia and Oxidative Stress Study, Department of Biochemistry & Biology Molecular, Faculty of Medicine, Universitas Indonesia, Jakarta, Indonesia
Corresponding author:
Uly A. Nikmah
E-mail: uly_alfinikmah@yahoo.com
Background
Urea biosynthesis is a very important process in the liver which needs ATP, CO2 and functional mitochondria or aerobic condition. Liver can adapt to hypoxic condition, generally and locally. This study aimed to analyze the effect of chronic hypoxia on liver urea biosynthesis as indicated by the level and specific activity of mRNA of carbamoyl phosphate synthetase 1 (CPS1), a key enzyme in urea biosynthesis in hypoxic rats.
Methods
20 male Sprague-Dawley rats were placed in hypoxic chamber supplied by a mixture of 10% O2 and 90% N2. Five rats were sacrificed at 1, 3, 5, and 7 days after exposure. Liver homogenates were analyzed for HIF- 1 (hypoxia inducible factor-1) by ELISA, CPS1 mRNA by real time RT-PCR and CPS1 enzymatic specific activities by Pierson method. Data were analyzed by ANOVA test and Pearson correlation.
Results
The HIF-1 in liver increased significantly, as well as CPS1 mRNA and CPS1 enzymatic activities (p<0.05). There was a strong correlation (r=0.618; p<0.01) between the level of CPS1 mRNA and CPS1 enzymatic activities, moderate correlation between HIF-1 and CPS1 mRNA (r=0.419; p<0.05) but no correlation between HIF-1 and CPS1 enzymatic activities. The study indicated that urea biosynthesis in liver was affected by hypoxia and partially under HIF-1 regulation. The study also found increase of urea and NH3 biosynthesis related to proteolysis as indicated by the decrease of total body weight and liver weight.
Conclusion
There was an increase in the expression and specific activities of CPS1 in urea biosynthesis as a result of increasing proteolysis in chronic hypoxic condition.
Keywords
CPS1, HIF-1, hypoxia, urea biosynthesis
Liver is a vital organ that plays major role in metabolism as well as detoxification.1,2 Despite different roles, both types of these functions are connected each other, and it is not easy to distinguish them. In general, nutritional metabolism is aimed to produce energy and intermediate metabolites as precursor for synthesis of important biological compounds, such as hormones. On the other side, the objective of xenobiotic metabolism is to detoxify non-nutritional compound, which is dangerous for the body. It is not always easy to classify, whether a metabolic pathway is unique for nutritional or xenobiotic, eg. urea biosynthesis which represents one of the most important function of liver. As a metabolic pathway, urea cycle or biosynthesis treats ammonia/nitrogen trihydride (NH3) as a normal product of amino acid-protein metabolism; however NH3 is very toxic, especially for central nervous system. The liver exerts its functions to convert this substance into urea to eliminate toxic effect of NH3 through urea cycle or biosynthesis.1,3
Ammonia itself is continuously formed as byproduct in amino acid metabolism. Urea biosynthesis is a mitochondrial dependent pathway. Part of this process occurs in this organelle and needs adenosine triphosphate (ATP) as energy source and carbon dioxide (CO2). Both are produced in mitochondria and need aerobic metabolism. It is very important to know, whether urea biosynthesis, as an oxygen dependent process, would be affected by hypoxia condition.4 Liver hypoxia may occur as a consequence of several conditions, such as chronic heart failure,5 chronic obstructive pulmonary disease (COPD),6 or severe anemia.7
The aim of this study was to analyze the effect of chronic hypoxia on liver urea biosynthesis as indicated by the level and specific activities of messenger ribonucleic acid (mRNA) of carbamoyl phosphate synthetase 1 (CPS1), the first and the key enzyme in the urea biosynthesis. The enzyme was observed at mRNA and protein level, i.e. as enzyme activities. Considering that much of adaptative responses to hypoxia are under the control of hypoxia inducible factor-1 (HIF-1), we also observed this transcription factor protein in the form of the subunit-1, HIF-1α.
METHODS
This was an experimental study conducted on 25 male Sprague-Dawley rats, weighing 150-200 grams. The animals were obtained from Institute of Veterinary Research, Ministry of Agriculture, Bogor, West Java, Indonesia. The protocol of experiment was approved by Ethical Review Committee of the Faculty of Medicine, Universitas Indonesia (No. 115/H2.FI/ETIK/2013).
Hypoxia treatment
Animals were adapted to the animal house condition for two weeks. Body weight was measured before and after treatment. Experiment was conducted by placing 20 rats in a close chamber, connected to the gas cylinder containing gas mixture of 90% N2 and 10% O2 at 1 atm pressure. Five rats were taken as control group and placed in normal cage. Animals were sacrificed before treatment (day-0) and on day-1, -3, -5, and -7 of experiment; five rats each time. The liver was taken and placed in phosphate buffer saline (PBS) pH 7.4 containing anti-protease and kept in freezer of -80° C.
Expression of CPS1
Liver homogenization and isolation of total
RNA
The livers were kept in -80°C freezer in PBS solution, and taken from the solution before measured. Liver tissue was cut to pieces of about 100 mg using scalpel and scissor, and placed in a new sterile microtube for each rat. Liver was placed on ice gel pack during the manipulation to prevent protein denaturation or losing its enzyme activity. Liver was homogenized in micro-homogenizer with a sterile micro-pestle by addition of 500 mL Tripure isolation reagent (Roche, Cat. No. 11 667 165 001). The reagent isolates deoxyribonucleic acid (DNA), ribonucleic acid (RNA), and protein at once from the same sample. Another 500 mL Tripure was added and the mixture was homogenized once again, then cold centrifuged (2-8°C) at 12,000 g for ten minutes. The supernatant containing DNA, RNA, and protein was placed in another 1.5 mL sterile microtube and incubated for 15 minutes at 15- 25°C for complete dissociation of nucleoprotein, followed by addition of 200 mL chloroform. The tube was shaken rigorously for 15 seconds then incubated at the same temperature for 2-15 minutes. The second 12,000 g centrifugation was performed for 15 minutes in 2–8°C. The mixture was separated into three phases: the upper-clear contained RNA, the middle-white, contained DNA, and the lowest-red, contained protein. The clear upper phase containing RNA was separated carefully and put into sterile 1.5 mL microtube. The middle and lower phases were separated and stored at 2–8°C for one night. RNA in upper phase was precipitated by addition of 500 mL isopropanol, followed by inversion of the tube upside-down several times and 5–10 minutes incubation at 15–25°C. After the incubation, the microtube was cold centrifuged at 12,000 g for ten minutes. Supernatant was discarded and the white precipitate of RNA was washed in 1 mL 75% ethanol. The mixture was vortexed and followed by another cold centrifugation at 7,500 g for five minutes. Supernatant was decanted and the RNA precipitate was dried by placing the micro tube inverted on a filter paper for 5–10 minutes. RNA was redissolved by adding 50 mL RNase-free water followed by incubation at 55-60°C for 10–15 minutes. The RNA solution was divided into three aliquots of 20 mL each and stored at -20°C. The purity of RNA was measured with spectrophotometer at 260 nm and 280 nm.
cDNA Amplification
Measurement of each mRNA was performed indirectly by real time reverse transcription polymerase chain reaction (RT-PCR), using KAPA SYBR FAST One-Step quantitative RTPCR (qRT-PCR) Kit (KAPA Biosystem, Cat. No. KK4651). By this technique, the number of copy deoxyribonucleic acid (cDNA) molecule synthesized is proportional to the number of mRNA template molecule, and the process is quantified real time by adding fluorescence. In this case SYBR green is hardly fluoresced in free condition, but fluoresced 1,000 times when bound to a double strand DNA. For the reaction, 5 mL KAPA Sybr qPCR Master Mix (2x), 0.2 mL of 200 nM forward primer, 0.2 mL 200 nM reverse primer, 0.2 mL KAPA RT Mix (50x), 1 mL template RNA (100 ng/mL), and nuclease free water 13.4 mL, total volume was 20 mL. Synthesis of cDNA proceed during 10 minutes at 42°C, followed by inactivation of reverse transcriptase at 95°C for five minutes. PCR cycles (30-40 cycles) and detection: ten seconds at 95°C, 30 seconds at 57.3°C (for CPS1) or 56°C (for 18s rRNA), 30 seconds at 72°C. For melting curve analysis, the mixture was incubated for one minute at 95°C, one minute at 55°C, ten seconds at 55°C (80 cycles, by increasing temperature 0.5°C/cycle). Nuclease free water was used as negative control in place of RNA template. Relative gene expression was counted according to method of Livak.8
Measurement of mRNA expression
Messenger RNA (mRNA) of HIF-1a and CPS1 were assayed by counting the number of cDNA copies and it was done by RT-PCR, using 18s rRNA as positive control. Primers for CPS1 were as follows: Forward 5’-GGCTTTGGTTTGGCCAATGT-3’ (accession number NM_017072.1) and Reverse 5’-TCCGAGTACCCTCCTAAGCC-3’. Primers for 18s rRNA were: Forward 5’-CGCGGTTCTATTTTGTTGGT-3’ and Reverse 5’-AGTCGGCATCGTTTTATGGTC-3’ (accession number NR_046237,1).
Specific activities of CPS1
Protein and enzyme assay
Total liver homogenate proteins of HIF-1 and CPS1 were measured in different ways. Total protein concentration was determined chemically by biuret technique, non-enzyme protein like HIF-1a was measured by ELISA (Cusabio, Cat. No. CSBE08540r) whereas CPS-1 protein was measured by the enzymatic activities according to technique of Pierson.9
Total protein content
Piece of liver weight about 100 mg, was homogenized as describe previously. However, instead of separated by Tripure, homogenized was suspended in 1,000 mL PBS pH 7.4. After a centrifugation for five minutes in 5,000 g, 25 mL supernatant was aspirated and placed in a tube containing 2 mL biuret reagent. Absorbance was read at 540 nm against blank, distilled water. Standard curve was made from a series of seven dilution of 6% bovine serum albumin.10
Measurement of HIF-1 concentration by ELISA (Enzyme-linked immunosorbent assay)
Liver homogenate was added with protease inhibitor phenyl methyl sulfonyl fluoride (PMSF), and kept overnight in -20°C, followed by freezing for one hour at -20°C and thawing for 30 minutes at room temperature three times in the following day. The homogenate was then cold centrifuged 5,000 g for five minutes. Samples were titred by addition of PBS to make gradient of sample concentration according to the kit manual (Cusabio, Cat. No. CSB-E08540r). Briefly, 100 mL sample was added to 96 well ELISA microplate, which was previously coated with HIF-1 responding element (HRE). After two hours incubation at 37°C, the supernatant was removed and biotin labelled antibody anti-HIF-1 was added and incubated for one hour at 37°C, followed by three times washing. Furthermore, addition of 100 mL/well avidin-horse radish peroxidase conjugate, incubated for one hour at 37°C, then washed five times. Tetramethylbenzidine (TMB) substrate was added to each well and incubated for 15–30 minutes at 37°C in the dark. Finally, 50 mL stop solution was added to each well, absorbance was read within five minutes at 450 nm (wavelength).
Enzyme activity of CPS1
Enzyme activity of CPS1 was assayed according to technique of Pierson,9 which was expressed as the amount of urea produced. A standard curve of urea was made. Briefly, substrate solution, containing ammonium bicarbonate (NH4HCO3), ATP, magnesium acetate, N-acetyl glutamate, dithioerythritol, and ethanolamine, was mixed with enzyme solution (liver homogenate) and incubated for ten minutes at 37°C. The urea was then converted into hydroxyurea by addition of hydroxylamine. The mixture was incubated at 95°C. After ten minutes of incubation, chromogenic reagent, containing antipyrine, and diacetyl monoxyme, in acidic solution (20% sulfuric acid/H2SO4 and 2.5% acetic acid/ CH3COOH) was added. The absorbance was read at 458 nm and the value was plotted on the urea standard curve for quantification.
Data analysis
Data were analyzed statistically with SPSS program v.16. The normality of all data was examined by Shapiro-Wilk test and the homogeneity by Levine test. Normally distributed data were analyzed with ANOVA-test (each group compare with control group) followed by least significance difference (LSD) post-hoc test whenever differences found. Correlation between two parameters (CPS1 mRNA and CPS1 enzymatic activities, HIF-1 and CPS1 mRNA, HIF-1 and CPS1 enzymatic activities) was done using Pearson correlation test. Data which are not normally distributed, will be analyzed by non-parametric methods using Kruskal-Wallis or Mann-Whitney tests. P-value of 0.05 was taken as the limit of statistical significance.11
RESULTS
HIF-1 activities
Hypoxia-inducible factor-1 (HIF-1) was measured as specific protein using ELISA method. The results expressed HIF-1 protein divided by total protein concentration in the same sample. The sample optimal dilution was 1/1,200 which was used during the experiment. It is clear that HIF-1 decreases slightly on day one, but increases significantly on day three and day five (p<0,05) (Figure 1).
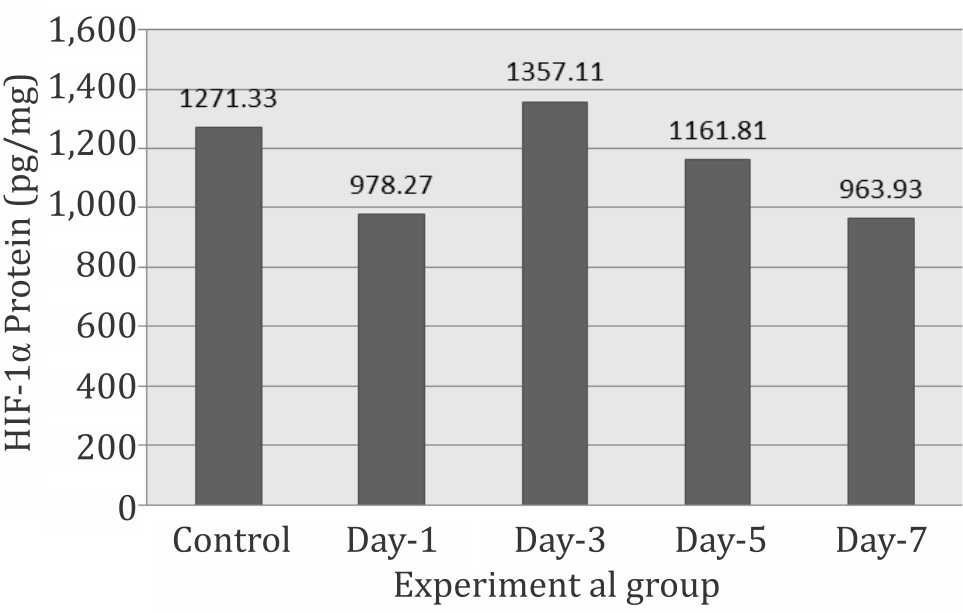
Figure 1. Expression of HIF-1α protein during systemic chronic hypoxia
CPS1 mRNA level
CPS1 increased significantly on day-1 then decreased progressively on day-3, -5, and reached the lowest level on day-7, suggesting the occurrence of total body hypoxia, which triggered the liver to express the CPS1 (Figure 2).
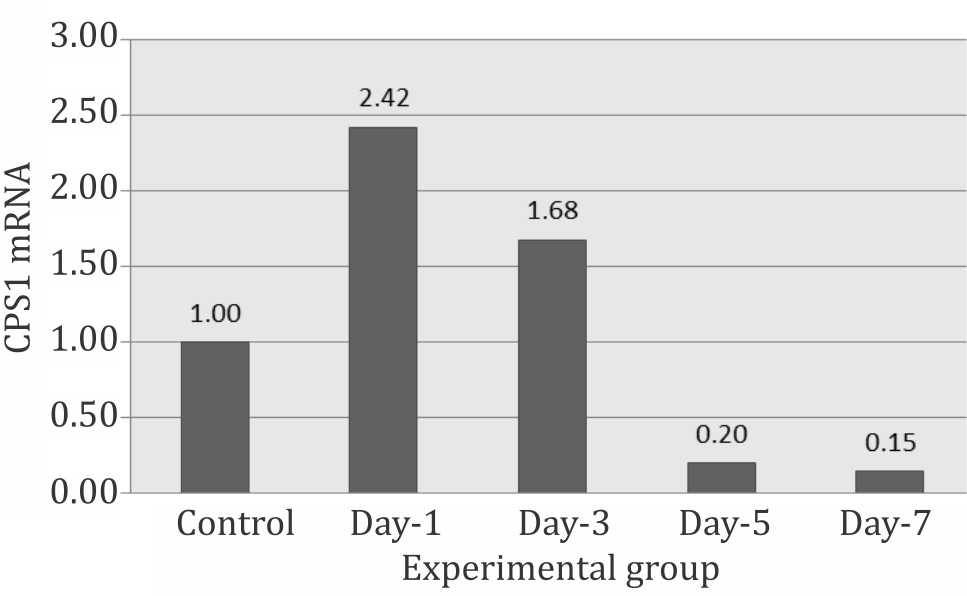
Figure 2. Relative expression of CPS1 mRNA during systemic hypoxia
CPS1 enzymatic activity
The activity of CPS1 was calculated based on the intercept of the absorbance of the liver enzymatic product with the curve or with the formula obtained. The result of CPS1 activity is shown in figure 3. It is clearly seen that CPS1 activity increased drastically (±181% of control) on day-1 and decreased progressively from day-3 to day-7 (±125% that of day-1). However, during the experiment, the activities of CPS1 were still significantly higher than normal control from day-1, -3, -5, and -7 (p<0.05) (Figure 3).
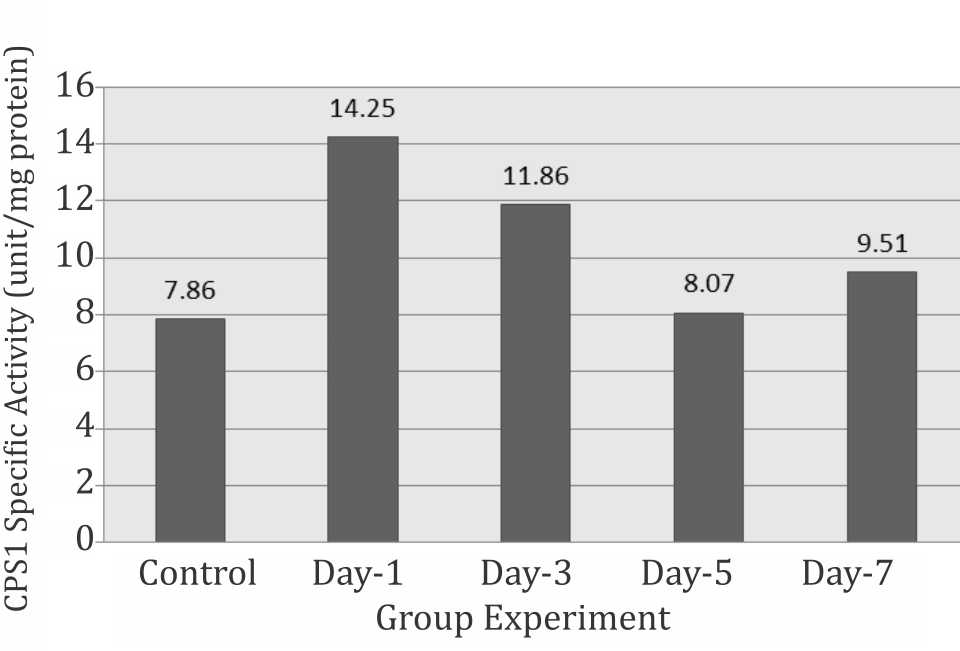
Figure 3. Specific activity of CPS1 during systemic chronic hypoxia
Correlation of HIF-1 and CPS1
Hypoxia-inducible factor-1 (HIF-1) is well known as a very responsive protein to hypoxia condition.12 This study showed that CPS1 responds to hypoxia in function of time, at mRNA level as well as at protein or enzymatic level. Statistical analysis showed a moderate correlation between HIF-1 and CPS1 mRNA (r=0.419; p=0.037), a strong correlation between CPS1 mRNA and CPS1 enzyme activity (Pearson coefficient, r=0.618; p<0.001), but no correlation between HIF-1 and enzymatic activities of CPS1 (r=0.049, p>0.05).
DISCUSSION
Urea biosynthesis, also well known as Krebs- Henseleit cycle or urea cycle, is one of the most important liver functions.13 The role of this metabolic pathway is to detoxify NH3 which is continually formed as a result of transamination and deamination of amino acids. Ammonia is known very toxic for the central nervous system.14 In hepatic failure, the capacity of liver in urea synthesis is markedly reduced. Consequently, most of blood ammonia fail to be converted into urea. As a result, central nervous system is intoxicated and the subject will fall into hepatic coma.13,14
Half of the urea cycle occurs in mitochondrion.15,16 The NH3 is converted to bigger molecule (the urea) through a ATP-dependent process. Urea also contains a carbonyl group, meaning that the urea biosynthesis needs CO2. The process occurs with high efficiency in mitochondrion, where ATP as well as CO2 are abundantly available. Both compounds are available only in mitochondrion in aerobic condition.17
Hypoxic condition often occur systemically or locally. Local hypoxia may happen in any organ, as a result of local or even segmental decrease of blood flow, for instance in atherosclerosis or thrombus. If it occurs in brain or heart, the subject will undergo stroke or heart attack. Local hypoxia can also occur in liver.18 In this case, it is important to know what happens in liver cells with total body hypoxia for a relatively long time. The objective was to know whether the urea biosynthesis affected by total body hypoxia. Multicellular organism has several ways for adaptation in a relatively lack of O2 condition and some of them are coordinated genetically by a gene producing a protein, HIF-1 which is discovered in mid-90’s by Semenza.12 HIF-1 is a transcription factor which regulates the expression of an important number of genes. As reported previously, HIF-1 also increased in response to hypoxia12,19,20 as well as a proof of hypoxic liver cells.
Urea biosynthesis needs aerobic condition. The process involves five enzymes to work in a cycle. The first reaction, formation of carbamoyl phosphate is the key reaction. The activity of catalyzing enzyme, CPS1 controls and indicates the activity of the synthesis process where one molecule of carbamoyl phosphate eventually gives one molecule of urea. In this study, it was found that the longer the period of hypoxia the greater activities of CPS1, suggesting more NH3 was converted into urea. The NH3 originated from transamination and deamination of amino acids suggesting that prolonged hypoxia will increase the number of total free amino acids (which was not measured in this study). However, free body amino acids may come from proteolysis and the food intake. This study showed decrease in the rats body and liver weight during the prolonged hypoxia, suggesting that a certain degree of proteolysis might occur. The free amino acids, after deamination will be used for synthesis of glucose (gluconeogenesis) in ATP production. It is well known that in hypoxia condition, energy production is dominated by anaerobic glycolysis with lactate, instead of CO2 and water as end product, in which two ATP in place of 36 ATP are formed.
Hypoxia-inducible factor-1 (HIF-1) is known as a master gene because it regulates nearly 100 genes.20,21 In general, the genes can be divided into three groups: genes that regulate proteins needed for maintaining the tissue oxygen supply, genes whose products are needed for adaptation to hypoxia by switching the metabolism to anaerobic type, and finally genes that control the efficiency of the overall metabolism by adjusting the total body mass with the energy production capacity.
Anaerobic glycolysis is triggered by HIF-1 by upregulation of lactate dehydrogenase to anaerobic isoform,22 key enzyme of gluconeogenesis.21 One of the raw material for gluconeogenesis is amino acid, which must be liberated from the body proteins reserve. Activities of proteasome was increased under the control of HIF-1.23 CPS1, the key enzyme in urea biosynthesis may be under HIF-1 control. In this study, there was moderate correlation between HIF-1 and CPS1 mRNA and no correlation between HIF-1 and CPS1 specific activities. It suggests that HIF-1 might up-regulate the CPS1 mRNA expression, but it did not translate all mRNA into CPS1 protein as can be seen in the control rats liver, where a substantially high CPS1 activitiy was detected. In fact, urea biosynthesis is a very important pathway and kept working all the time independently with external control. However the role of HIF-1 in regulating CPS1 has to be elucidated and it needs further studies by binding of HIF-1 to promoter region of CPS1 and also the influence of increase of the HIF-1 content, stimulated by non-hypoxia pathway, on the CPS1 content.
In conclusion, expression and specific activity of CPS1 in urea biosynthesis in rats liver were increased and affected by hypoxia and partially under HIF-1 regulation.
Conflicts of Interest
The authors affirm no conflict of interest in this study.
Acknowledgment
This study is part of research project entitled “Regulation of glutaminase, carbonic anhydrase, H/K-ATPase and carbamoyl phosphate synthetase expression by HIF-1 in hypoxia condition”, funded by DRPM-UI Research Grant No. DRPM/RII/238/RU-UI/2013 (Riset Utama Universitas Indonesia, 2013).
REFERENCES
- Botham KM, Mayes PA. The respiratory chain and oxidative phosphorylation. In Harper’s Illustrated Biochemistry, editor. 28th ed. New York: McGrawHill ; 2006. p. 103–12.
- Nath B, Szabo G. Hypoxia and hypoxia inducible factors: diverse roles in liver diseases. Hepatology. 2012;55(2):622–33.
- Marks DB, Marks AD, Smith CM. Biokimia kedokteran dasar: sebuah pendekatan klinis. In: Suyono J, Sadikin V, Mandera LI, editors. Basic medical biochemistry: a clinical approach. Jakarta: Penerbit EGC; 1996. p. 701–50. Indonesian.
- Pekkala S, Martinez AI, Barcelona B, Gallego J, Bendala E, Yefimenko I, et al. Structural insight on the control of urea synthesis: identification of the binding site for N-acetyl-L-glutamate, the essential allosteric activator of mitochondrial carbamoyl phosphate synthetase. Biochem J. 2009;424(2):211–20.
- Suarez I, Bodega G, Fernandez B. Glutamine synthetase in brain: effect of ammonia. Neurochem Int. 2002;41(2– 3):123–42.
- Kurashima K, Hoshi T, Takaku Y, Kanauchi T, Nakamoto K, Ueda M, et al. Changes in the airway lumen and surrounding parenchyma in chronic obstructive pulmonary disease. Int J Chron Obstruct Pulmon Dis. 2013;8:523–32.
- Mydin HH, Murphy S, Clague H, Sridharan K, Taylor IK. Anemia and performance status as prognostic markers in acute hypercapnic respiratory failure due to chronic obstructive pulmonary disease. Int J Chron Obstruct Pulmon Dis. 2013;8:151–7.
- Livak KJ, Schmittgen TD. Analysis of relative gene expression data using real-time quantitative PCR and the 2-ΔΔC T method. Methods. 2001;25(4);402-8.
- Pierson DL. A rapid colorimetric assay for carbamyl phosphate synthetase 1. J Biochem Biophys Methods. 1980;3(1):31–7.
- Harahap, Indriati P. Analysis of blood biochemistry: biochemistry of laboratory experiment. Department of Biochemistry, Faculty of Medicine, Universitas Indonesia. 2001.
- Dahlan MS. Statistik untuk kedokteran dan kesehatan: deskripsi, bivariate, multivariat, dilengkapi aplikasi dengan menggunakan SPSS. 5th Ed. Salemba Medika: Jakarta; 2011. 167–88. Indonesian
- Semenza GL. Hypoxia-inducible factor-1: oxygen homeostasis and disease pathophysiology. Trends Mol Med. 2001;7(8):345–50.
- Lieberman M, Marks AD. Basic medical biochemistry: a clinical approach. 3rd Ed. Philadelphia: Lippincot Williams and Wilkins; 2009; 697–711.
- Adeva MM, Gema S, Natalia B, Donapetry Cristóbal. Ammonium metabolism in humans. Metabolism clinic and experimental. 2012;61:1495–511.
- Thoden JB, Xinyi H, Frank M. Carbamoyl-phosphate synthetase: creation of an escape route for ammonia. Journal of Biology Chemical. 2002;277:39722–7.
- Pekkala S, Martínez AI, Barcelona B, Gallego J, bendala E, Yefimenko I, et al. Structural insight on the control of urea synthesis: identification of the binding site for N-acetyl-L-glutamate, the essential allosteric activator of mitochondrial carbamoyl phosphate synthetase 1. Biochemical J. 2009:424(2);211–20.
- Nord FF. Mechanism and regulation of the glutaminedependent carbamyl phosphate synthetase of Escherichia coli. In: Meister A, editor. Advances in enzymology and related areas of molecular biology. New York: John Wiley and Sons; 1989; 315–74.
- Kietzmann T, Cornesse Y, Brechtel K et al. Perivenous Expression of the mRNA of three hypoxia-inducible factor alpha subunits, HIF-1alpha, HIF-2-alpha, HIF- 3alpha, in rat liver. Biochem J. 2001; 354: 531–7.
- Dufour JF, Clavien PA. Signalling pathways in liver disease. 3rd ed. Berlin: Springer; 2005; 442.
- Kaluz S, Kaluzová M, Stanbridge EJ. Regulation of gene expression by hypoxia: integration of the HIF transduced hypoxic signal at the hypoxia-responsive element. Clinica Chimica Acta. 2008; 395(1–2): 6–13.
- Greijer AE, Up-regulation of gene expression by hypoxia is mediated predominantly by hypoxia-inducible factor 1 (HIF-1). Journal Pathology. 2005;206: 291–304.
- Nuria P. Hypoxia promotes glycogen accumulation through Hypoxia Inducible Factor (HIF)-mediated induction of glycogen synthase 1. PLoS One. 2010; 5(3): e9644.
- Storey, KB. Biochemical adaptation. in: Storey KB (Ed.). Functional metabolism: regulation and adaptation. Wiley-Liss, Inc, Hoboken, New Jersey. 2004; p. 383–413.
Copyright @ 2016 Authors. This is an open access article distributed under the terms of the Creative Commons Attribution-NonCommercial 4.0 International License (http://creativecommons.org/licenses/by-nc/4.0/), which permits unrestricted non-commercial use, distribution, and reproduction in any medium, provided the original author and source are properly cited.
mji.ui.ac.id