Section Abstract Introduction Methods Results Discussion Conflict of Interest Acknowledgment References
Clinical Research
Renal evaluation in patients with type 2 diabetes mellitus and its association with diastolic blood pressure
pISSN: 0853-1773 • eISSN: 2252-8083
http://dx.doi.org/10.13181/mji.v25i1.1329 Med J Indones. 2016;25:25–32
Received: December 21, 2015
Accepted: March 11, 2016
Author affiliation:
1 Faculty of Medicine, Autonomous University of the State of Mexico (UAEMex). Jesús Carranza esq. Paseo Tollocan, Moderna de La Cruz, C.P. 50180, Toluca, México
2 Asociación Científica Latina A.C. (ASCILA) and Ciprés Grupo Médico (CGM), Felipe Villanueva sur 1209. Col. Rancho Dolores. C.P. 50170. Toluca, México
3 Diabetes Clinic, Regional Hospital “Gral. Ignacio Zaragoza", ISSSTE. General Ignacio Zaragoza 1711, Ejército Constitucionalista, Iztapalapa, 09220, México
Corresponding author:
Fokine D. Anna
E-mail: annadotsenko_20@hotmail.com
Background
HbA1c is correlated with the estimated glomerular filtration rate (eGFR) and diastolic blood pressure (DBP). Our main objective was to evaluate the trend of biochemical and clinical variables, in relation to the eGFR in patients with type 2 diabetes mellitus (T2DM).
Methods
This was a retrospective, longitudinal, and descriptive study, including patients with T2DM, who were cared for from January 2014 until December 2014, at the Clínica de Diabetes, Hospital Regional “Gral. Ignacio Zaragoza", ISSSTE, Mexico City, Mexico. eGFR was calculated using three formulas: the chronic kidney disease – epidemiology collaboration (CKD-EPI), Cockcroft-Gault, and modification of diet in renal disease (MDRD), during two periods of observation, 3 and 6 months. The results were compared by Student t tests or Wilcoxon-Mann-Whitney test depending on the variable distribution. Pearson correlation was employed to determine the relation between the eGFR determined with each formula and the analyzed variables.
Results
The mean age was 56.5±11.3 years in the group of 3 months’ follow-up (n=110) and 57.1±13.8 years in the group of 6 months’ follow-up (n=47). In both groups, the formula with the lowest percentages of cases of CKD was CKD-EPI and the difference of this formula had a basal and final significant positive correlation with the DBP.
Conclusion
The CKD-EPI formula showed the lowest percentages of cases of CKD in a short follow-up period, and its difference is consistently associated with the DBP, confirming the importance of controlling the later to mitigate the evolution to CKD.
Keywords
CKD-EPI, Cockcroft-Gault, MDRD, type 2 diabetes mellitus
Lack of adherence to treatment involves large economic expenditures. Worldwide studies claim that one half of patients with type 2 diabetes mellitus (T2DM) do not adequately comply with their treatment and that fewer than 30% of patients change their habits or lifestyles.1 Compliance with adequate and intensive treatment is related with the delay in disease onset.2
Measuring adherence presents difficulties because there is no unique method ascribed for it. The World Health Organization (WHO) defines adherence as the extent to which the behavior of a person corresponds to the recommendations agreed upon between the health professional and the patient, in terms of taking medications, monitoring a dietary treatment, and executing the programmed lifestyle changes.3 Some authors have demonstrated that the best adherence percentage achieved in chronic patients ranges between 50 and 75%.
Based on studies of T2DM, the latter is the leading cause of chronic kidney disease (CKD)4 even where it is not related with histological diabetic nephropathy.5 Incipient diabetic nephropathy is classically defined as increasing albuminuria, heralding a decline in the glomerular filtration rate (GFR). In fact, the prevalence of CKD in patients with T2DM is estimated to be 25–40% worldwide.6
Monitoring of renal function should be carried out by calculating the estimated GFR (eGFR), with three main techniques currently with widespread use: 1) the chronic kidney disease – epidemiology collaboration (CKD-EPI) equation, which generally results in lower prevalence of CKD and more accurate assessment of prognosis;7 2) the Cockcroft-Gault formula, which indicates creatinine clearance, and 3) the modification of diet in renal disease (MDRD) formula, which evidences eGFR.8
The formula developed by Cockcroft and Gault possesses a good correlation with the true GFR and is clinically useful in patients aged 20–100 years; however, it has strong limitations in diabetes and should therefore be avoided, in addition its being overestimated in situations of advanced renal insufficiency and especially in obese and edematous patients.9 On the other hand, the MDRD combines nutrition and sociodemographic variables is recommended by the National Kidney Disease Education Program (NKDEP) to measure GFR in adult population.10 This formula tends to underestimate eGFR at higher levels, but performs better at lower eGFR (≤60 mL/min per 1.73 m2). Last, the CKD-EPI equation was developed in an effort to create a more precise formula than the MDRD, especially when the actual GFR is >60 ml/ min/1.73 m2.11.
HbA1c is correlated with the eGFR and diastolic blood pressure (DBP).12 In fact, a short term glycemic control can get reductions of blood pressure and GFR.13 This study aimed to describe the most consistent variables associated with deterioration in eGFR using the CKD-EPI, Cockcroft-Gault, and MDRD equations within a time-frame period of three and six months in patients with T2DM.
METHODS
Patients
This was a retrospective, longitudinal, and descriptive study developed at the Clínica de Diabetes, Hospital Regional “Gral. Ignacio Zaragoza”, ISSSTE, Mexico City, Mexico. Patients with T2DM, of all ages, seen from January until December 2014, irrespective of metabolic control, were included in the study. We excluded patients not willing to participate in the study, and those who missed an appointment during the study were eliminated.
Following a 12 hours fasting, venous blood samples were taken in Vacutainer™ tubes for determination of glucose, total cholesterol, high-density lipoprotein cholesterol (HDL-ch), low-density lipoproteincholesterol (LDL-ch), triglycerides, and uric acid (Hitachi 917® Autoanalyzer) and HbA1c. Capillary blood glucose was measured with a Precision® glucose monitor. Serum glucose was measured utilizing the glucose oxidase method, and HbA1c, with the turbidimetric inhibition immuno assay (TINIA) method (Roche).
Clinical assessment
After their blood samples were taken, the patients ate breakfast from 9–10 a.m., and filled in the directed history (only at their first appointment), a survey of ingested kcal in the previous 24 hours, and a questionnaire on diabetes. Two hours post breakfast glucose was measured, and the patients received education on diet, self-monitoring, exercise, American Diabetes Association (ADA) therapeutic targets, and chronic complications through classes and workshops.
Patients were measured (m) and weighed (kg) (Torino). Body mass index (BMI) was calculated as weight (kg) divided by height (m) squared. Blood pressure was measured with a mercury sphygmomanometer (Baumanometer, USA) after five min of rest.
A 24-hours dietary recall was used for this purpose. Diet was categorized within three choices: 1) consumption of 80–120% of the indicated kcal; 2) <80% of the indicated kcal, and 3) >120% of the kcal indicated. Diet was classified as dichotomous whether this had or had not a balanced proportion of 50–60% carbohydrates, 10–20% protein, and <30% fat. Calculated kcal were based on ideal weight minus 200 kcal/day if the patient was overweight.
Exercise (intensive walking, running, or cycling) was reported in days per week of physical activity and min/day. A specific activity was not prescribed due to the heterogeneous work schedule and physical conditions of the patients.
Glomerular filtration rate
The GFR determination was made with the next aforementioned formulas:
CKD-EPI formula
eGFR = 141 × min(SCr/κ,1)α × max(Scr/κ,1)-1.209 × 0.993Age × 1.018 [if female] × 1.159 [if black] Where SCr is serum creatinine (mg/dL), κ is 0.7 for females and 0.9 for males, α is –0.329 for females and –0.411 for males, min indicates the minimum of Scr/κ or 1, and max indicates the maximum of Scr/κ or 1.
Cockcroft and Gault formula
eGFR (mL/min) = [((140-age) × weight)/(72 × SCr)] × 0.85 if female
Age is expressed in years, weight is expressed in kilograms, and SCr is expressed in mg/dL.
MDRD
eGFR (mL/min/1.73 m²) = 186 × SCr⁽⁻¹∙¹⁵⁴⁾ × Age⁽⁻⁰∙²⁰³⁾ × 0.742 (woman) × 1.210 (if black) Where SCr = serum creatinine (mg/dL).
Statistics
Quantitative or continuous variables were described by mean and standard deviation (SD) and, in some cases, by median and range. Qualitative variables were described by absolute frequency and percentage per modality. Quantitative variables were compared between groups by Student t test in case of normal distribution and the Wilcoxon-Mann-Whitney test otherwise. Missing data were not replaced. The analyzed population was defined as all patients who fulfilled all inclusion criteria with no major protocol deviations. Intra- and intergroup differences between baseline and values after three or six months were analyzed with the Student t test. Pearson correlation was employed to determine the relation between the GFR determined with each formula and the variables analyzed. All tests were performed with the SPSS v.20 statistical software program.
Ethics
The Ethical and Research Committees of Ciprés Grupo Médico (CGM), code 2015/03, approved this study. The procedures followed were in accordance with the ethical standards of the General Health Law of Mexico and were subjected to the ethical and moral value judgments of the Declaration of Helsinki, updated in Fortaleza, Brazil.
RESULTS
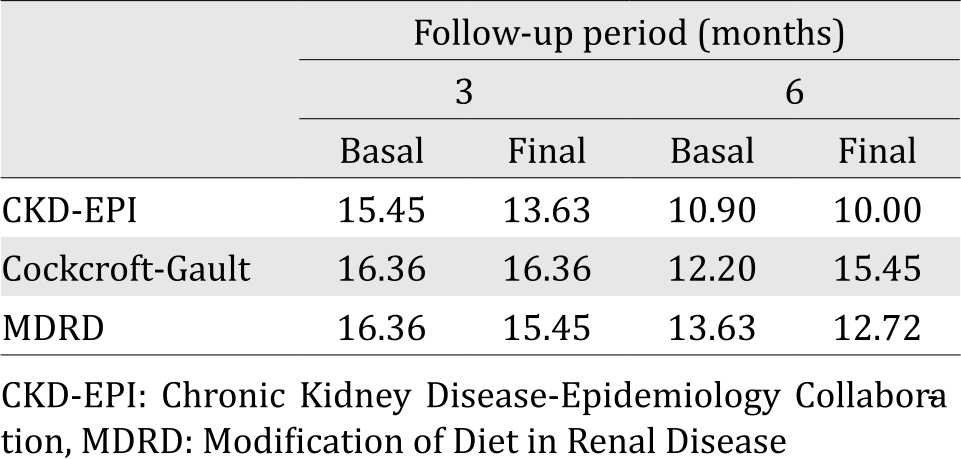
In the current study, mean age was 56.5±11.3 years in the group of the three-month follow-up (n=110; 71 females and 39 males) and 57.1±13.8 years in the six-month follow-up group (n =47; 28 females and 19 males). Table 1 depicts the general characteristics of the patients. In Table 2, we illustrate the percentages of patients with renal failure by using each formula. In both groups, the formula with lowest percentages of cases of CKD was CKD-EPI.
Table 1. General characteristics of the studied groups
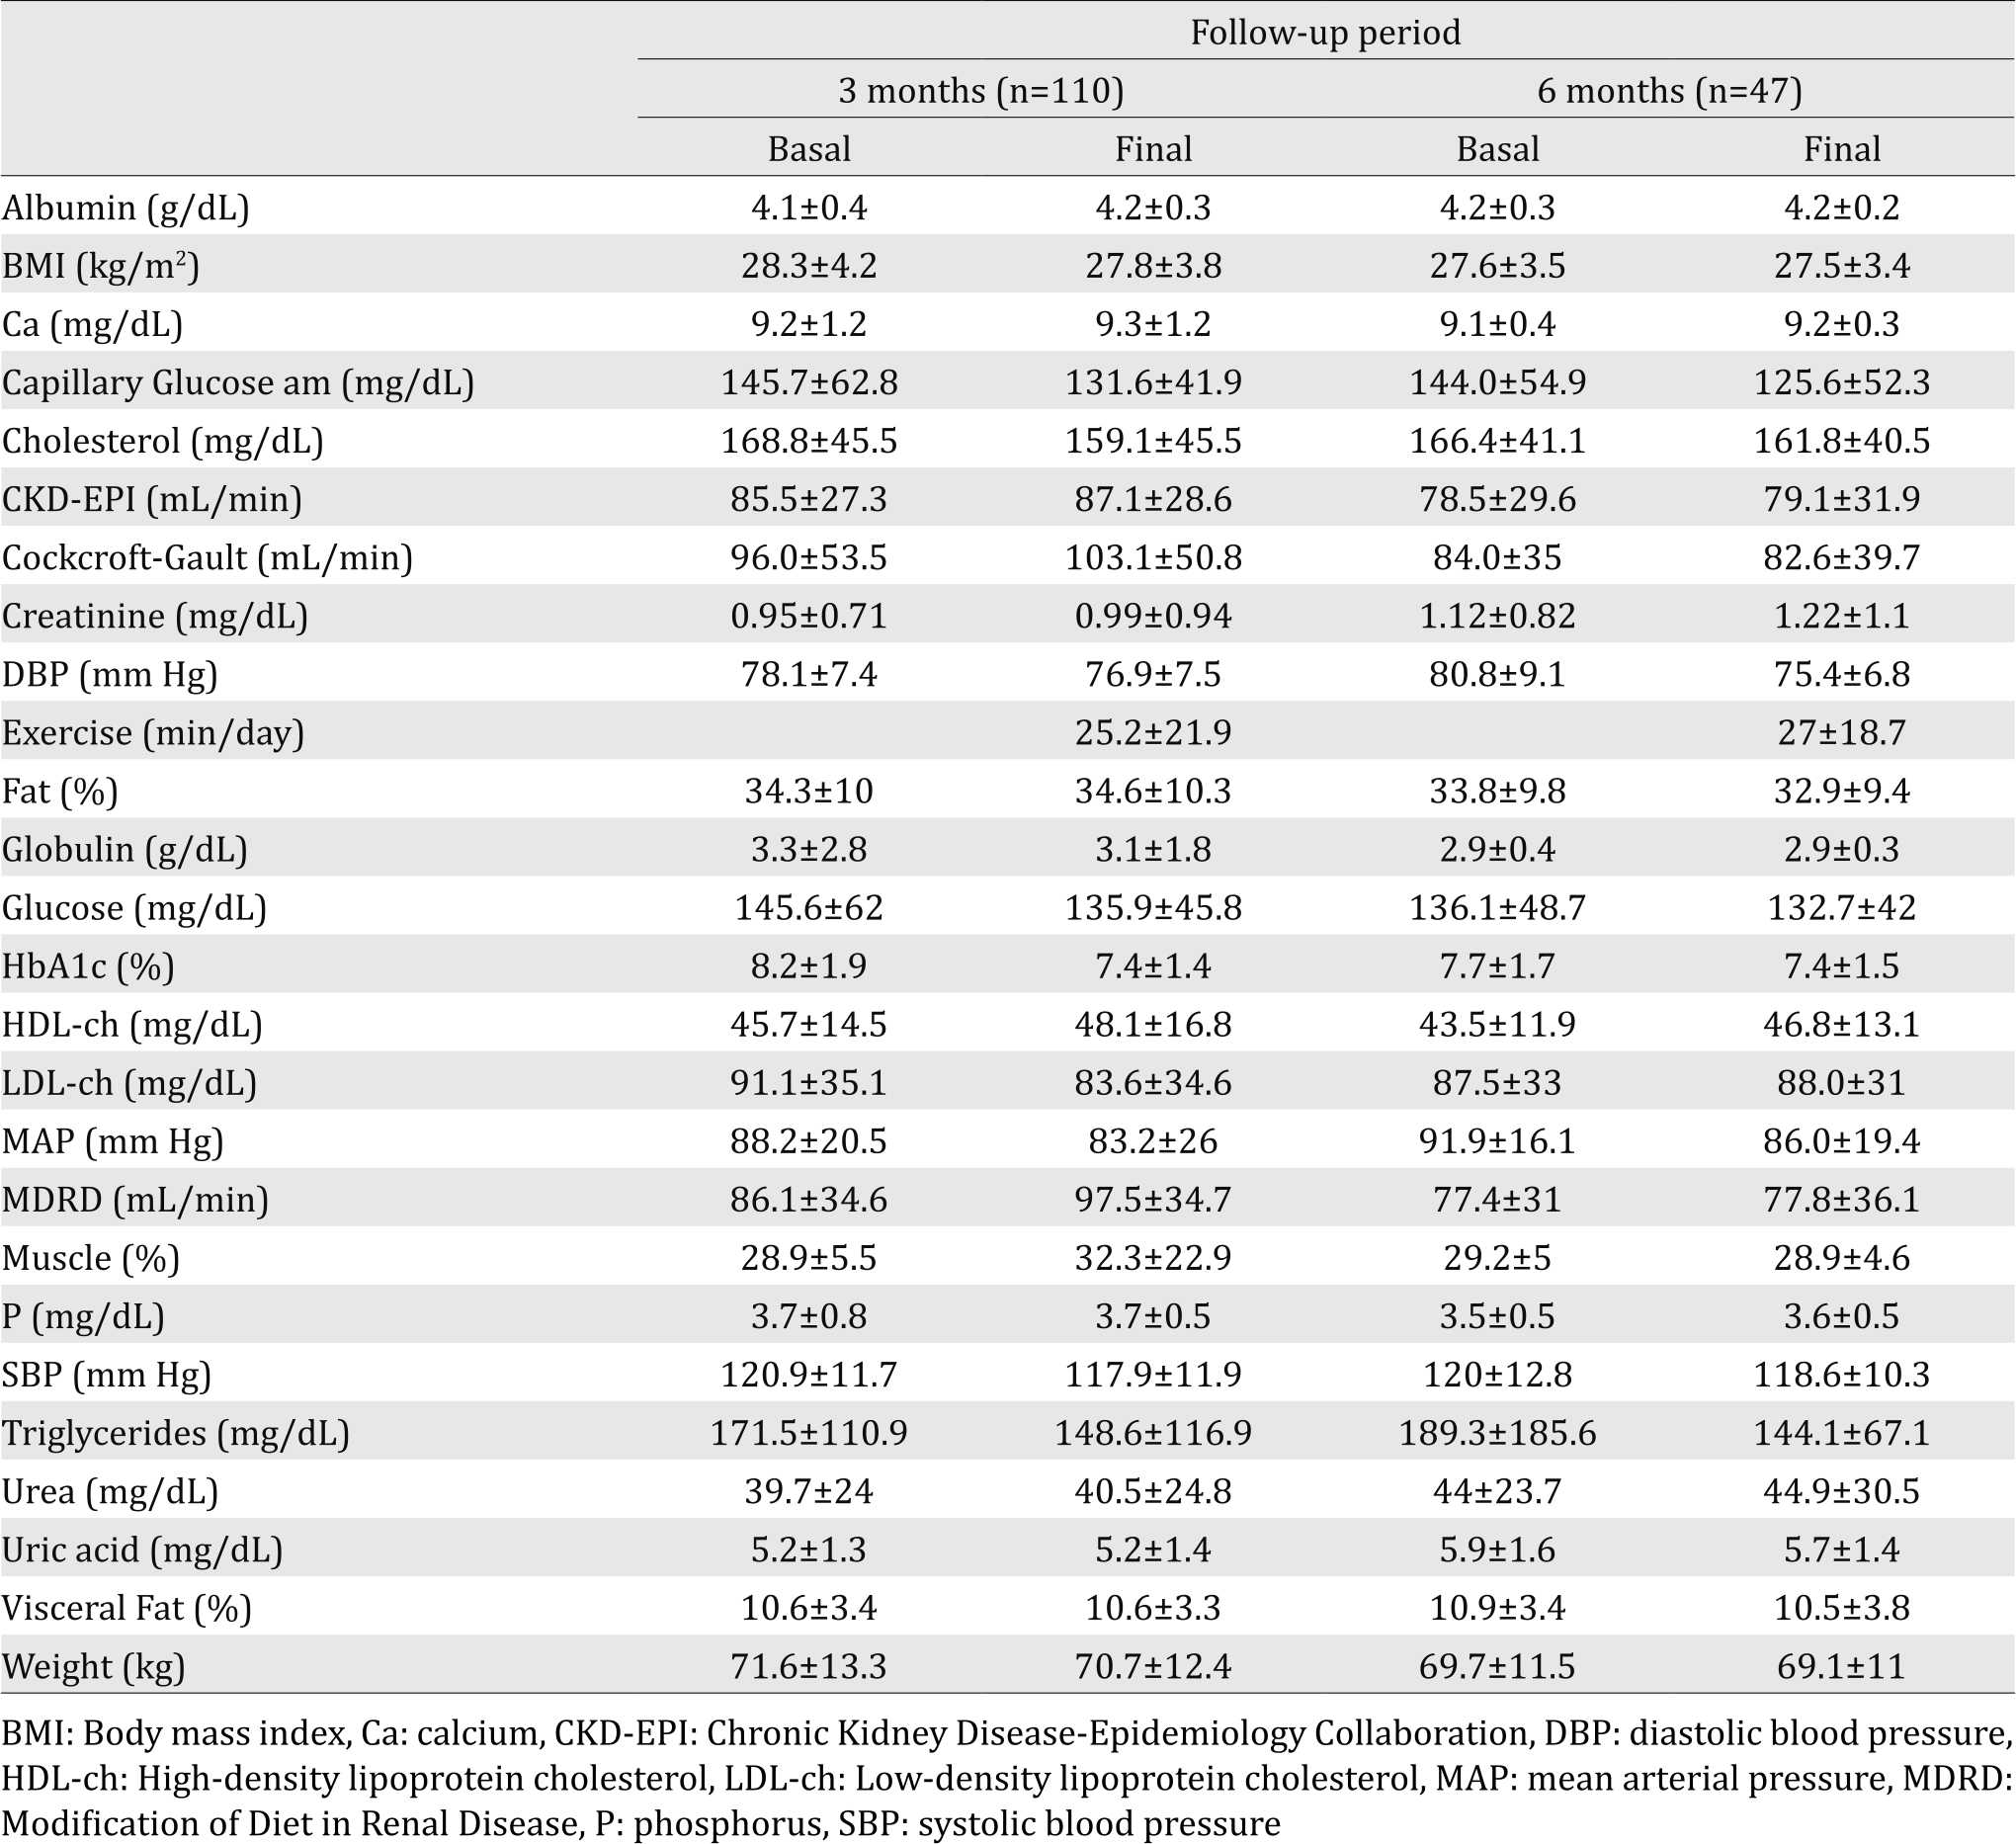
Table 2. Percentages of patients with renal failure
Among all of the analyzed variables, those that maintained a significant correlation during both periods are presented in Table 3 and Figure 1. As expected, age had a negative correlation with renal function; urea, creatinine, and uric acid all demonstrated all a significant negative correlation with the three formulas. In the lipid profile, there was a constant positive correlation between cholesterol and LDL and cholesterol and triglycerides, and a negative correlation between triglycerides and HDL. Notoriously, there was a negative correlation between urea and albumin. Measurements for blood pressure, as expected, correlated.
Table 3. Significant correlations at 3 and 6 months
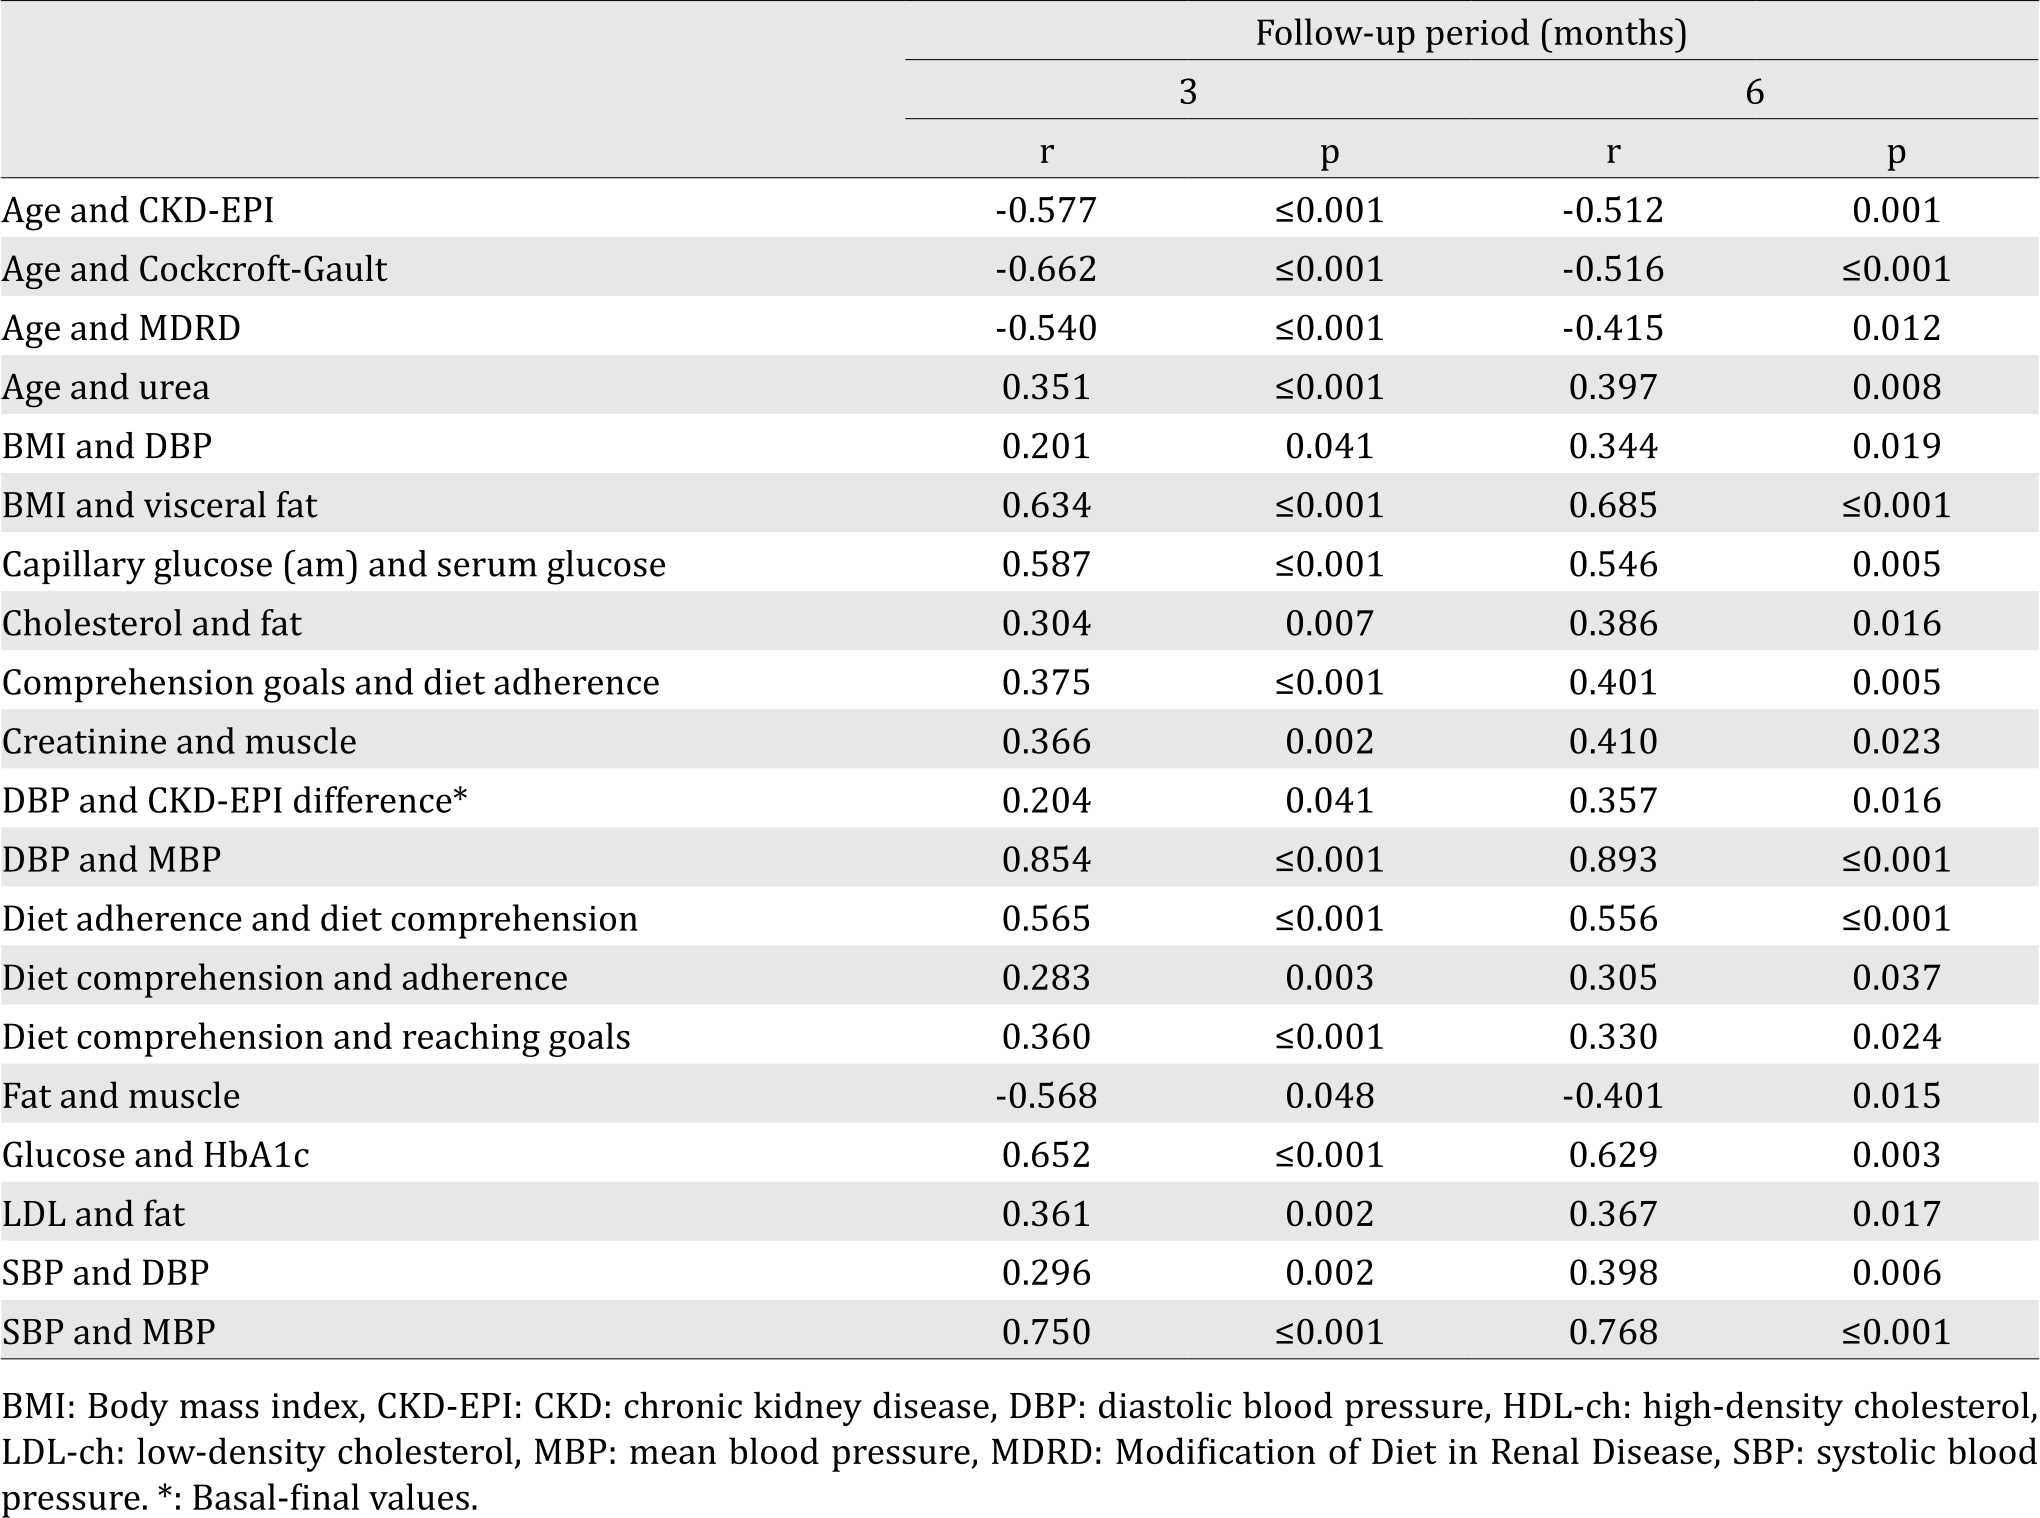
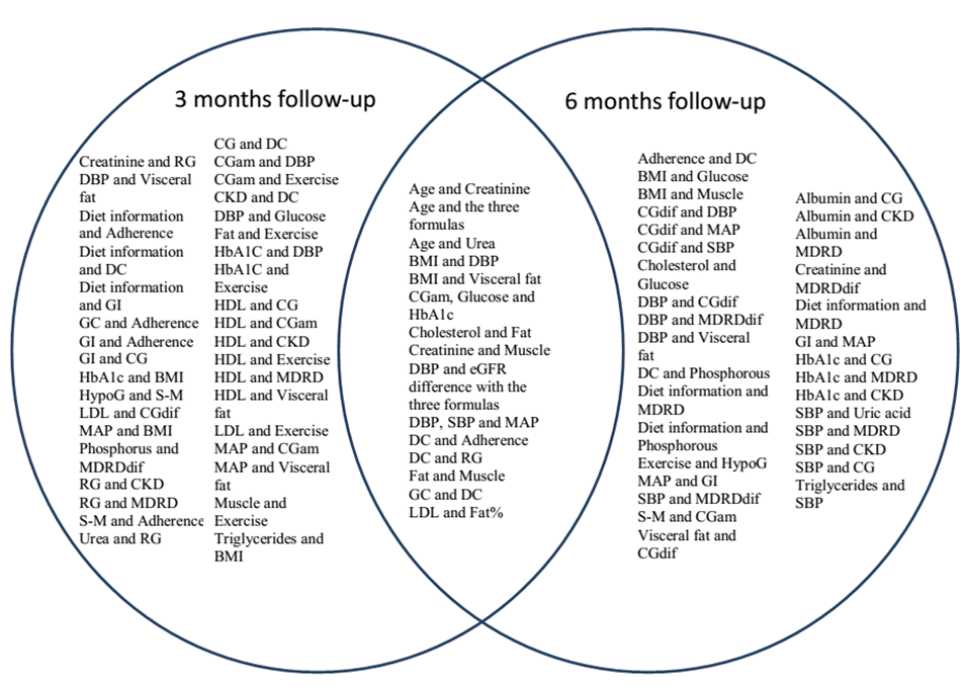
Figure 1. Significant correlations within a three and six month’s follow-up. BMI: body mass index, CG: Cockroft- Gault, CGam: Capillary glucose am, CKD-EPI: Chronic Kidney Disease – Epidemiology Collaboration, DBP: diastolic blood pressure, DC: Diet Comprehension, dif: difference (basal-final), eGFR: estimated glomerular filtration rate, GC: Goals in Comprehension, GI: Goals in Information, HDL: High-density lipoprotein, HypoG: Hypoglycemia, LDL: Low-density lipoproteins, MAP: mean arterial pressure, MDRD: Modification of Diet in Renal Disease, RG: Reaching goals, SBP: systolic blood pressure, S-M: Self-monitoring
The whole population, at baseline, exhibited the following negative Pearson correlation between urea and the three formulas evaluated to calculate eGFR, CKD-EPI (r=–0.876; p≤0.001), MDRD (r=– 0.826; p≤0.001), and Cockcroft-Gault (r=–0.742; p≤0.001). When analyzing the same variables for creatinine, the same order was maintained (r=–0.797, p≤0.001), (r=–0.779; p≤0.001), and (r=0.669; p£0.001). For uric acid, the significant negative correlations were only exhibited with two formulas; CKD-EPI (r=–0.511, p=0.001), and MDRD (r=–0.527; p≤0.001).
In the case of albumin, correlations were positive with MDRD (r=0.386; p=0.020), Cockcroft-Gault (r=0.379, p=0.023), and CKD-EPI (r=0.358; p=0.038). Among the equations, highest positive correlations were between CKD-EPI and MDRD (r=0.959; p≤0.001), second, between CKD-EPI and Cockcroft-Gault (r=0.883, p≤0.001), and last, between Cockcroft-Gault and MDRD (r=0.853; p≤0.001).
Through the multivariate lineal regression analysis in the group of three months follow-up, the variables with a significant prognosis for a final eGFR were age (p≤0.001 for both formulas), serum glucose (p=0.026 for MDRD and 0.015 for CKD-EPI) and urea (p=0.002 for MDRD and ≤0.001 for CKD-EPI). The same analysis in the group of six months showed that the initial value of urea was the only variable positively associated with the final eGFR calculated with CKD-EPI (p=0.008) and MDRD (p=0.005).
Finally, for the two periods, the only variable associated with an eGFR difference was DBP and CKD-EPI difference (basal–final), (three months: r=0.204, p=0.041; six months: r=0.357, p=0.016). By contrast, the second measure of HbA1C had a negative correlation with the eGFR difference using the Cockcroft-Gault and MDRD (r=-0.245, p=0.011) formulas in the shorter period (three months).
DISCUSSION
In both groups, there was a predominance of female patients. This is in accordance with several publications that report more assiduous medical consultation from women than from men.14
In general, there were more significant correlations among variables within threemonths than the six-months period. This means a loss of power in the direct or indirect interactions that, otherwise, allows identification of stronger correlations despite the time involved. This finding is in concordance with a previous study designed to evaluate the effectiveness of a shortterm, community-based, individualized lifestyle intervention in patients with mild diabetes or hypertension who exhibited beneficial changes in activity, dietary, and clinical parameters.15 In a longer follow-up, another group demonstrated that, in order to sustain the impact of a communitybased comprehensive intervention for T2DM, improving and repeating the comprehensive strategy is greatly recommended, especially for patients with lower educational levels.16
Non-adherence to diabetes medications is associated with higher rates of mortality.17 In a previous publication of our group, we demonstrated that education programs in T2DM contribute to a decrease in HbA1c within six months, but an intensive program is more effective in reducing cholesterol and LDL.18 In this new approach within a shorter time period, we verified a positive correlation between diet comprehension and better adherence; this same diet comprehension facilitated reaching metabolic goals of control.
Ekinci et al19 suggest that aging, perturbations in blood pressure, and the development of intrarenal vascular disease may contribute to decreases in renal function independently of changes in albuminuria.19 It is likely that these data will remain constant in all countries.
It has been suggested that poor glycemic control may cause the risk of substantially increased blood pressure (BP) variability in subjects with diabetic nephropathy.20 In our two groups with different follow-up periods, this relationship was not found. The explanation is that this correlation was performed in all patients at each time and in each group, and not only in subjects with CKD.
Classification of subject as CKD or non-CKD patients by different equations implies the assignment of a different risk of end-stage renal disease (ESRD); all-cause mortality, coronary artery disease, and stroke. For example, employing the MDRD equation in patients with T2DM underestimates GFR in patients with normal and high GFR21 and may be inaccurate in patients with normo-albuminuric patients with diabetes.22 In agreement with this statement, other authors have found that prevalence of CKD was lower using Cockcroft-Gault or CKD-EPI formulae than MDRD formulae.23,24 It is critical because being considered as CKD, low eGFR, and higher systolic blood pressure (SBP) are risk factors that are independently associated with peripheral arterial disease.25 Even more so, in the study of Fabbian et al24 the authors found that eGFR was <60 ml/ min/1.73 m2 in 15% of patients by MAYO, 26% by Cockcroft-Gault, 27% by MDRD186, 31.5% by MDRD175, and 30% by CKD-EPI. In contrast, in our patients, percentages were lower with the CKD-EPI formula. This difference could be attributed to the fact that the population that we studied was younger by about ten years.
Lifestyle interventions and good diabetes control are also linked with reduction of proteinuria and alleviation of CKD progression.26-29 In our patients, the exercise had a negative correlation with HbA1c only in the short follow-up period. With deeper analysis, a higher increase is appreciated in creatinine, urea, and uric acid after six months than after three months despite a better control of serum glucose, capillary glucose, HbA1c, lipid profile, and BP.
Therapeutic management of diabetes is more challenging in patients with renal impairment. CKD vs non-CKD patients have less strict glycemic control.30 Greater emphasis should be placed on the major risk factors, such as hypertension, smoking habits, and hyperlipidemia.31
This study has several limitations. First, we were not able to categorize CKD based on the new kidney disease: improving global outcomes (KDIGO) classification recommendations32 due to missing information about the albuminuria reports. Second, we did not estimate cystatin C, which is constantly produced and excreted by the kidney and has been recommended to be taken into account.33 Third, the cardiovascular risk score of each patient was not assessed, and subjects who suffered a cardiovascular event could have a lower renal function than those who did not. However, our aim was merely to show how the different formulae work in a clinical setting and their usefulness associated with the variables that show the most important changes and correlations.
We conclude that, in a short evaluation period in patients with T2DM, the CKD-EPI formula shows the lowest percentages of cases of CKD. Besides, the eGFR difference calculated with CKD-EPI had a significant positive correlation with the DBP.
Conflicts of Interest
The authors affirm no conflict of interest in this study.
Acknowledgment
Authors thank the medical and nursery staff of the Diabetes Clinic, Regional Hospital “Gral. Ignacio Zaragoza”, ISSSTE and Maggie Brunner M.A., for her excellent help with the English style correction.
REFERENCES
- Gigoux LJP, Moya Rivera P, Silva RJ. Adherencia al tratamiento farmacológico y relación con el control metabólico en pacientes con DM2. Rev Chil Salud Pública. 2010;14(2-3):238–70. Mexican.
- Durán-Varela BR, Rivera-Chavira B, Franco-Gallegos E. [Pharmacological therapy compliance in diabetes]. Salud Publica Mex. 2001;43(3):233–6.
- Cruz HJ, Licea PME, Hernández GP, Abraham MEA, Yanes QM. Aldosa reductasa y proteína quinasa C en las complicaciones crónicas de la Diabetes Mellitus. Rev Latinoamer Patol Clin. 2011;58(2):102–7. Mexican.
- Vejakama P, Ingsathit A, Attia J, Thakkinstian A. Epidemiological study of chronic kidney disease progression: a large-scale population-based cohort study. Medicine (Baltimore). 2015;94(4):e475.
- Sharma SG, Bomback AS, Radhakrishnan J, Herlitz LC, Stokes MB, Markowitz GS, et al. The modern spectrum of renal biopsy findings in patients with diabetes. Clin J Am Soc Nephrol. 2013;8(10):1718–24.
- Penno G, Solini A, Bonora E, Fondelli C, Orsi E, Zerbini G, et al. Clinical significance of nonalbuminuric renal impairment in type 2 diabetes. J Hypertens. 2011;29(9):1802–9.
- Earley A, Miskulin D, Lamb EJ, Levey AS, Uhliq K. Estimating equations for glomerular filtration rate in the era of creatinine standardization: a systematic review. Ann Intern Med. 2012;156(11):785–95.
- Rigalleau V, Beauvieux MC, Gonzalez C, Raffaitin C, Lasseur C, Combe C, et al. Estimation of renal function in patients with diabetes. Diabetes Metab. 2011;37(5):359–66.
- Coresh J, Stevens LA. Kidney function estimating equations: where do we stand? Curr Opin Nephrol Hypertens. 2006;15(3):276–84.
- Levey AS, Coresh J, Greene T, Stevens LA, Zhang YL, Hendriksen S, et al. Using standardized serum creatinine values in the modification of diet in renal disease study equation for estimating glomerular filtration rate. Ann Intern Med. 2006;145(4):247–54.
- Stevens LA, Schmid CH, Greene T, Zhang YL, Beck GJ, Froissart M, et al. Comparative performance of the CKD Epidemiology Collaboration (CKD-EPI) and the Modification of Diet in Renal Disease (MDRD) Study equations for estimating GFR levels above 60 mL/ min/1.73 m2. Am J Kidney Dis. 2010;56(3):486–95.
- Gómez-Marcos MA, Recio-Rodríguez JI, Patino-Alonso MC, Agudo-Conde C, Gómez-Sánchez L, Gómez-Sanchez M, et al. Cardio-ankle vascular index is associated with cardiovascular target organ damage and vascular structure and function in patients with diabetes or metabolic syndrome, LOD-DIABETES study: a case series report. Cardiovasc Diabetol. 2015;14:7.
- Uezima CB, Zanella MT, Sachs A, Pimazzoni Netto A, Zach PL. [Efect of short term glycemic control on microalbuminuria and glomerular filtration rate in type 2 diabetic patients with poor glycemic control]. J Bras Nefrol. 2012;34(2):130–8.
- Zanetti ML, Arrelias CC, Franco RC, Santos MA, Rodrigues FF, Faria HT. Adherence to nutritional recommendations and sociodemographic variables in patients with diabetes mellitus. Rev Esc Enferm USP. 2015;49(4):619–25.
- Yu R, Yan LL, Wang H, Ke L, Yang Z, Gong E, et al. Effectiveness of a community-based individualized lifestyle intervention among older adults with diabetes and hypertension, Tianjin, China, 2008-2009. Prev Chronic Dis. 2014;11:120333.
- Qi L, Feng L, Tang W, Ma X, Ding X, Mao D, et al. A community-based comprehensive intervention program for 7200 patients with type 2 diabetes mellitus in Chongqing (China). Int J Environ Res Public Health. 2014;11(11):11450–63.
- Currie CJ, Peyrot M, Morgan CL, Poole CD, Jenkins-Jones S, Rubin RR, et al. The impact of treatment noncompliance on mortality in people with type 2 diabetes. Diabetes Care. 2012;35(6):1279–84.
- Gutiérrez Herrera VR, Zerón HM, Mendieta Alcántara MR. Adherence to two methods of education and metabolic control in type 2 diabetics. Ethiop J Health Sci. 2015;25(2):163–70.
- Ekinci EI, Jerums G, Skene A, Crammer P, Power D, Cheong KY, et al. Renal structure in normoalbuminuric and albuminuric patients with type 2 diabetes and impaired renal function. Diabetes Care. 2013;36(11):3620–6.
- Liu F, Wu M, Feng YH, Zhong H, Cui T, Huang YQ, et al. Influence of HbA1c on short-term blood pressure variability in type 2 diabetic patients with diabetic nephropathy. J Zhejiang Univ Sci B. 2013;14(11):1033–40.
- Ibrahim H, Mondress M, Tello A, Fan Y, Koopmeiners J, Thomas W. An alternative formula to the Cockcroft- Gault and the modification of diet in renal diseases formulas in predicting GFR in individuals with type 1 diabetes. J Am Soc Nephrol. 2005;16(4):1051–60.
- Vervoort G, Willems HL, Wetzels JF. Assessment of glomerular filtration rate in healthy subjects and normoalbuminuric diabetic patients: validity of a new (MDRD) prediction equation. Nephrol Dial Transplant. 2002;17(11):1909–13.
- Pugliese G, Solini A, Bonora E, Orsi E, Zerbini G, Giorgino F, et al. The Chronic Kidney Disease Epidemiology Collaboration (CKD-EPI) equation provides a better definition of cardiovascular burden associated with CKD than the Modification of Diet in Renal Disease (MDRD) Study formula in subjects with type 2 diabetes. Atherosclerosis. 2011;218(1):194–9.
- Fabbian F, Pala M, Monesi M, De Giorgi A, Mallozzi Menegatti A, Tomasi F, et al. The estimation of glomerular filtration rate in type 2 diabetic patients may depend on the equation used. Eur Rev Med Pharmacol Sci. 2013;17(20):2791–7.
- Chou CK, Weng SW, Chang HW, Chen CY, Su SC, Liu RT. Analysis of traditional and nontraditional risk factors for peripheral arterial disease in elderly type 2 diabetic patients in Taiwan. Diabetes Res Clin Pract. 2008;81(3):331–7.
- Wakasugi M, Kazama JJ, Yamamoto S, Kawamura K, Narita I. A combination of healthy lifestyle factors is associated with a decreased incidence of chronic kidney disease: a population-based cohort study. Hypertens Res. 2013;36(4):328–33.
- Jones-Burton C, Mishra SI, Fink JC, Brown J, Gossa W, Bakris GL, et al. An in-depth review of the evidence linking dietary salt intake and progression of chronic kidney disease. Am J Nephrol. 2006;26(3):268–75.
- Nelson RG, Tuttle KR, Bilous RW, Gonzalez-Campoy JM, Mauer M, Molitch ME, et al. KDOQI Clinical Practice Guideline for Diabetes and CKD: 2012 Update. Am J Kidney Dis. 2012;60(5):850–86.
- Navaneethan SD, Yehnert H, Moustarah F, Schreiber MJ, Schauer PR, Beddhu S. Weight loss interventions in chronic kidney disease: a systematic review and metaanalysis. Clin J Am Soc Nephrol. 2009;4(10):1565–74.
- Penfornis A, Blicklé JF, Fiquet B, Quéré S, Dejager S. How are patients with type 2 diabetes and renal disease monitored and managed? Insights from the observational OREDIA study. Vasc Health Risk Manag. 2014;10:341–52.
- Di Landro D, Catalano C, Lambertini D, Bordin V, Fabbian F, Naso A, et al. The effect of metabolic control on development and progression of diabetic nephropathy. Nephrol Dial Transplant. 1998;13(Suppl8):35–43.
- Kidney Disease: Improving Global Outcomes (KDIGO) CKD Work Group. KDIGO 2012 clinical practice guideline for the evaluation and management of chronic kidney disease. Kidney Int Suppl. 2013;3:1–150.
- Fraser SD, Aitken G, Taal MW, Mindell JS, Moon G, Day J, et al. Exploration of chronic kidney disease prevalence estimates using new measures of kidney function in the health survey for England. PloS One. 2015;10(2):e0118676.
Copyright @ 2016 Authors. This is an open access article distributed under the terms of the Creative Commons Attribution-NonCommercial 4.0 International License (http://creativecommons.org/licenses/by-nc/4.0/), which permits unrestricted non-commercial use, distribution, and reproduction in any medium, provided the original author and source are properly cited.
mji.ui.ac.id