Section Abstract Introduction Methods Results Discussion Conflict of Interest Acknowledgment References
Clinical R esearch
The effect of fiber-rich milk and equi-carbohydrate snack on glycemic and insulin response and satiety feeling
pISSN: 0853-1773 • eISSN: 2252-8083
http://dx.doi.org/10.13181/mji.v25i2.1361 Med J Indones. 2016;25:85–92
Received: January 21, 2016
Accepted: May 23, 2016
Author affiliation:
Department of Nutrition, Faculty of Medicine, Universitas Indonesia, Jakarta, Indonesia
Corresponding author:
Dian Novita Chandra
E-mail: diannovitach@yahoo.com
Background
Additional dietary fibers which can decrease the glycemic response by slowing down digestion whilst maintaining the available carbohydrate content is one approach of healthy diet. This study aimed to compare postprandial glycemic and insulin response, hunger and satiety feeling after consuming fiber-rich milk compare with equicarbohydrate food as morning snack in healthy adults.
Methods
Cross-over study was conducted on 12 healthy subjects who fulfilled the criteria. Each test food was given after consuming standard breakfast. Venous blood samples for insulin and glucose level were taken before consuming test food, at 30, 60, 120, and 180 minutes after, and plotted against time to generate a curve. Hunger and satiety assessments were taken by visual analog scale (VAS) after each blood sampling.
Results
In average, age was 30.8+4.3 years old, body mass index was 20.6±1.6 kg/m2. Seven of twelve subjects were females. There were significantly differences in postprandial glycemic response (p<0.001), insulin response (p=0.045) and hunger feeling (p=0.021) between the two foods. However, postprandial satiety feelings were not different significantly (p=0.357). The glycemic response area under the curve of fiber-rich milk was significantly lower than the equi-carbohydrate snack (p=0.010).
Conclusion
Differences in glycemic and insulin response, and hunger feeling between two test foods, suggesting that fiber-rich milk can be used as an alternative snack for healthy adults. Further study is needed for the use of fiber-rich milk as an alternative snack for pre-diabetic patients.
Keywords
dietary fiber, glucose, insulin, satiety, visual analog scale
Healthy life style, among others is related to healthy eating of a balance diet, i.e. by balancing the variety of foods consumed proportionately in a regular eating schedule. It is becoming evident that modifying glycemic response of the diet is an element of the overall balanced diet and lifestyle.1
Scientific evidences clearly show that glycemic response can influence health outcomes related to key public health priorities, such as type 2 diabetes and blood glucose control.2 Worldwide, type 2 diabetes mellitus is increasing in its evidence, including in Indonesia, from 1.1% in 2007 to 2.1% in 2013.3 This health problem is associated with its fatal complication such as cardiovascular diseases and chronic kidney disease.4,5
Dietary strategy is amongst the recommended approach aims to preventing its evidence.2 However, as the major energy contribution to the diet, carbohydrate also leads to rises in blood glucose (glycemia). It is widely known that the glycemic response to food or meal is the effect that food or meals has on blood glucose levels after consumption. It is normal for blood glucose and insulin levels to rise after eating and then return again to fasting levels over a short period of time, particularly after consumption of meals rich in certain carbohydrates.6 Thus, reducing the size and duration of rises in blood glucose after meals is particularly beneficial to the general population.
High glycemic index (GI) foods are usually associated with high palatability and low satiety, encouraging overconsumption and therefore, as the onset of hyperglycemia and obesity.7 Evidence found that low GI foods or meals have a higher satiating effect than high GI foods or meals in short-term studies (one day or less).1 Visual analogue scales have been validated to measure subjective feelings on satiety to measure the impact of energy intake at a subsequent meal measured three to four hours after consuming a low or a high GI meal.
An alternative approach in reducing the GI in products, among others is by the addition of more slowly digestible carbohydrates (e.g dietary fibers such as polydextrose and inulin) to elicit a negligible direct blood glucose response. Fiber has an effect on glycemic response due to its effect in slowing down digestion whilst maintaining the available of carbohydrate content. Thus reducing the glycemic impact of the diet.1 Inulin and other fructans are considered as functional foods used since they affect physiological and biochemical processes in human beings for better health and reduction of many diseases risk.8 Furthermore, several studies have shown their effects on several conditions including regulating carbohydrate and lipid metabolism by lowering blood glucose level.
The absorption and metabolism of different carbohydrates influence postprandial glucose, insulin and non-esterified fatty acid concentrations. These postprandial metabolisms mediate an important influence on disease risk including type 2 diabetes. Serum insulin concentration increases as carbohydrate intake increases, in which it is also influenced by various factors such as body mass index (BMI), age and gender,9,10 gastric emptying,11 gut hormone release,12 and viscosity of the gut contents.13 It is evident that lower versus higher GI foods tend to show an attenuated insulin response, except for dairy products because of whey protein stimulates insulin secretion.14,15
However, there are not yet fully understood on the effect of non-digestible fiber on glycemic and insulin responses, in which the available data are still conflicting. This explains that the effect may depend on physiological (fasting versus postprandial state) or disease (diabetes).1 The non-digestible ingredients surely will have only minimal impact on blood glucose and insulin levels, but may have a modulating effect on appetite. Therefore, there is a need to do a longterm study to evaluate that inulin have an effect on reducing metabolic disease risks. However, such studies are very expensive, and as surrogate this study aims to see the effect of fiber-rich milk on the glycemic and insulin response as well as satiety feeling among healthy subjects, as an alternative approach to prevent hyperglycemia and its serious impact.
METHODS
This cross-over design study was conducted by following good clinical practice (GCP) and in compliance with the protocol at the Indonesian Nutrition Association head office in Central Jakarta from May to June 2015. The protocol of this study has been approved by Medical Ethics Committee, Faculty of Medicine Universitas Indonesia (No. 250/UN2.F1/ETIK/2015). Subjects were healthy male and female who were recruited by announcement to several offices in Central Jakarta. Subjects were screened on the following criterias, male and female, age range from 25 to 40 years, BMI between 18.5–22.9 kg/m2, fasting glucose <100 mg/dL,16 total cholesterol of <200 mg/dL, normal liver function [serum glutamic pyruvic transaminase (SGPT) laboratory test within normal range], normal kidney function (creatinine laboratory test within normal range), and no lactose intolerance.
According to the 1998 FAO/WHO expert consultation on carbohydrates, six subjects would be required for glycemic index research. This study used 12 subjects based on Venn et al17 recommendation of 10 subjects with the addition of 20% for drop outs.
The screening process was done from May 12th to June 10th 2015, to get 35 males and females to be screened for the trial. Eight females and six males were eligible, and 12 subjects were chosen consecutively.
The fiber-rich milk and equi-carbohydrate snack were given to the subjects in a cross-over protocol with each subject served as his or her own control. Subjects attended each examination day after consumed the same breakfast (350 Kcal) supplied by the researcher team between 5:00 to 6:00 a.m. The subjects were instructed not to consume unusually large meals or performed vigorous exercise on the previous day. Each of the subjects consumed each of the two different tested meals, i.e. fiber-rich milk and an equi-carbohydrate snack (rice flour porridge), on separate occasions with a week wash out period.
On the first examination day, subjects were given the fiber-rich milk as snack and an equicarbohydrate snack on the second examination day, a week after the first examination day. The fiber-rich milk was made up with 200 ml of warm water, and subjects were provided 600 ml of water to drink during each testing period. Each snack was given at 9:00 a.m and the subjects have to finish it in 12 minutes. The subjects were not allowed to consumed any additional food or drink during the three hours testing period, and remained in the testing place with minimal physical activity.
Blood glucose and insulin levels were measured in venous whole blood, obtained by a trained phlebotomist from the cubital vein at before consuming the test snack and followed by at 30, 60, 120, and 180 minutes after consumption of each test snack to provide blood glucose and insulin levels. Blood glucose and insulin level measurement were performed by Prodia Laboratory. Hexokinase method was used for blood glucose determination and chemiluminescence method was used for the determination of serum insulin level.
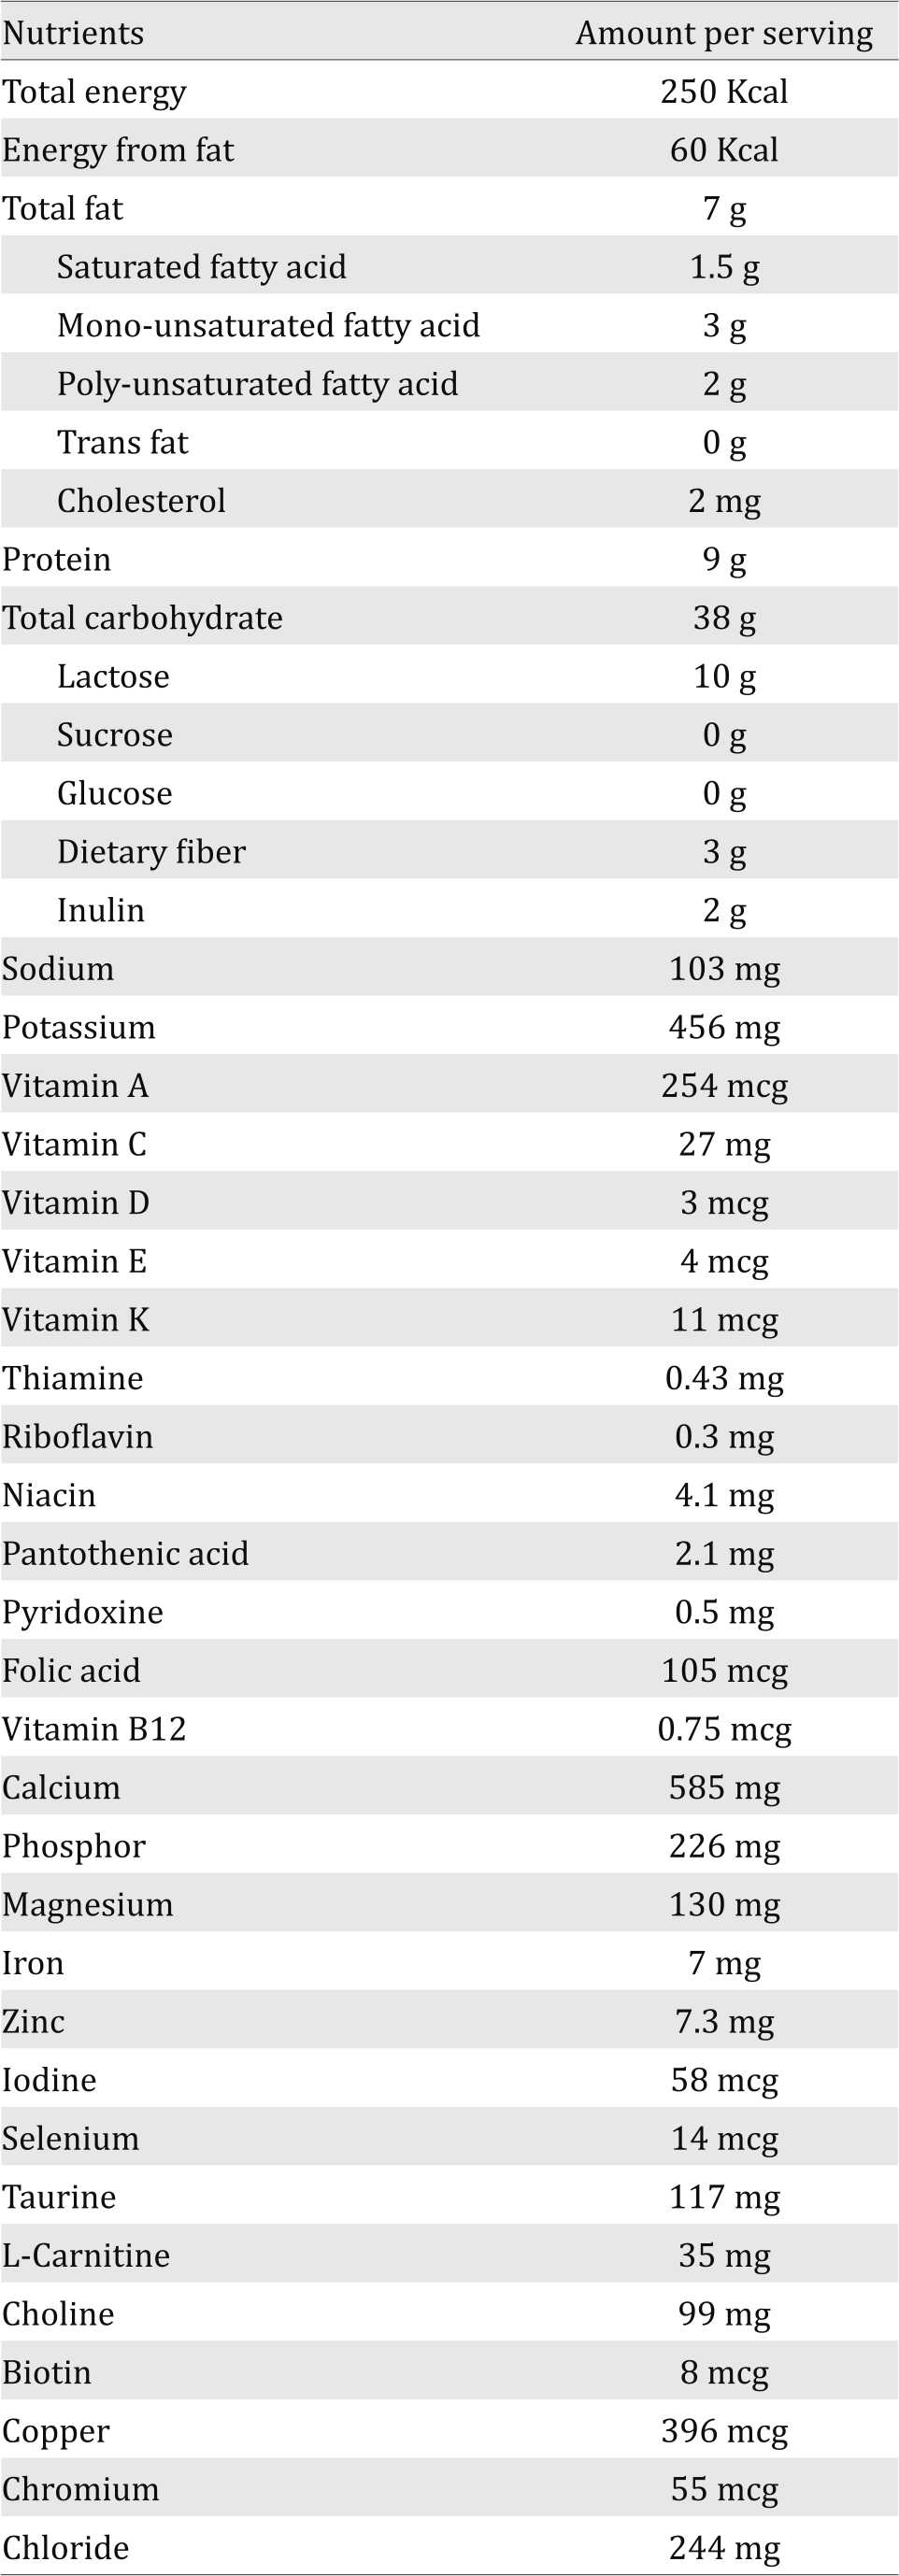
The data were plotted against time to generate a curve. The incremental area under the curve (AUC) was calculated for glycemic and insulin response.18 The satiety and hunger data were obtained by clinical nutrition physician by using a visual analog scale (VAS) questionnaire after each blood sample withdrawn. Table 1 shows the compositions of the fiber-rich milk product.
Table 1. Nutrient information of the fiber-rich milk product per serving (serving size: 60 grams)
The incremental area under the blood glucose response curves to each of the test snack was calculated geometrically using the trapezoid rule, ignoring the area below the baseline. Data were analyzed by using a general linier model (multiple measures ANOVA) for blood glucose response, insulin response, satiety and hunger VAS for each snack and time as fixed factors and subjects as random factors. The paired t test was used for comparing blood glucose AUC between two test snacks. The p<0.05 was considered as statistical significance. Statistical analysis was performed with SPSS for Windows v.20.0. Data were presented in mean±SD if normally distributed and in median (minimum-maximum) if not normally distributed. Normality of all data distribution was analyzed using Saphiro-Wilk test.
RESULTS
On the first examination day, one male subject did not come because could not leave his job. He was then replaced by another male subject. The screening process can be seen in Figure 1.
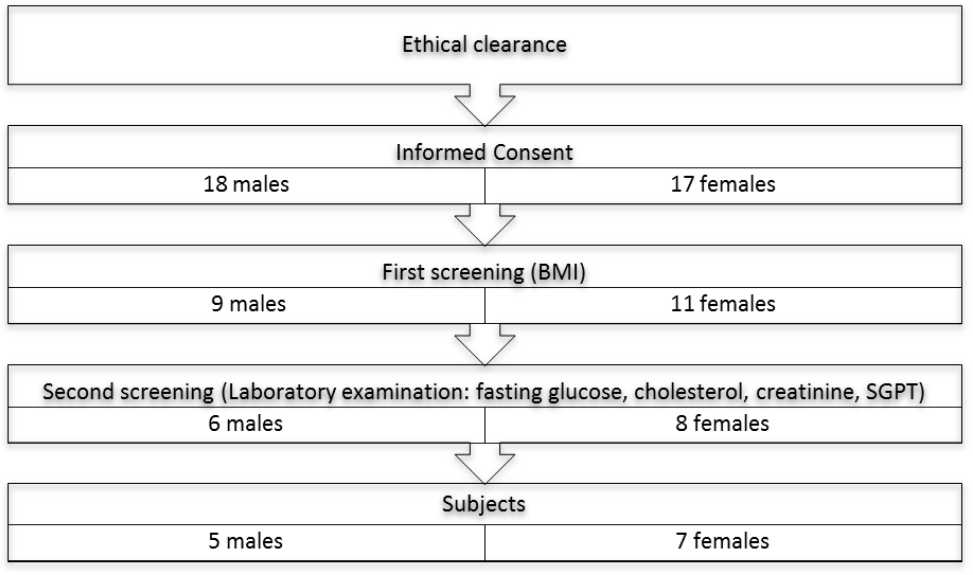
Figure 1. The screening process of the subjects
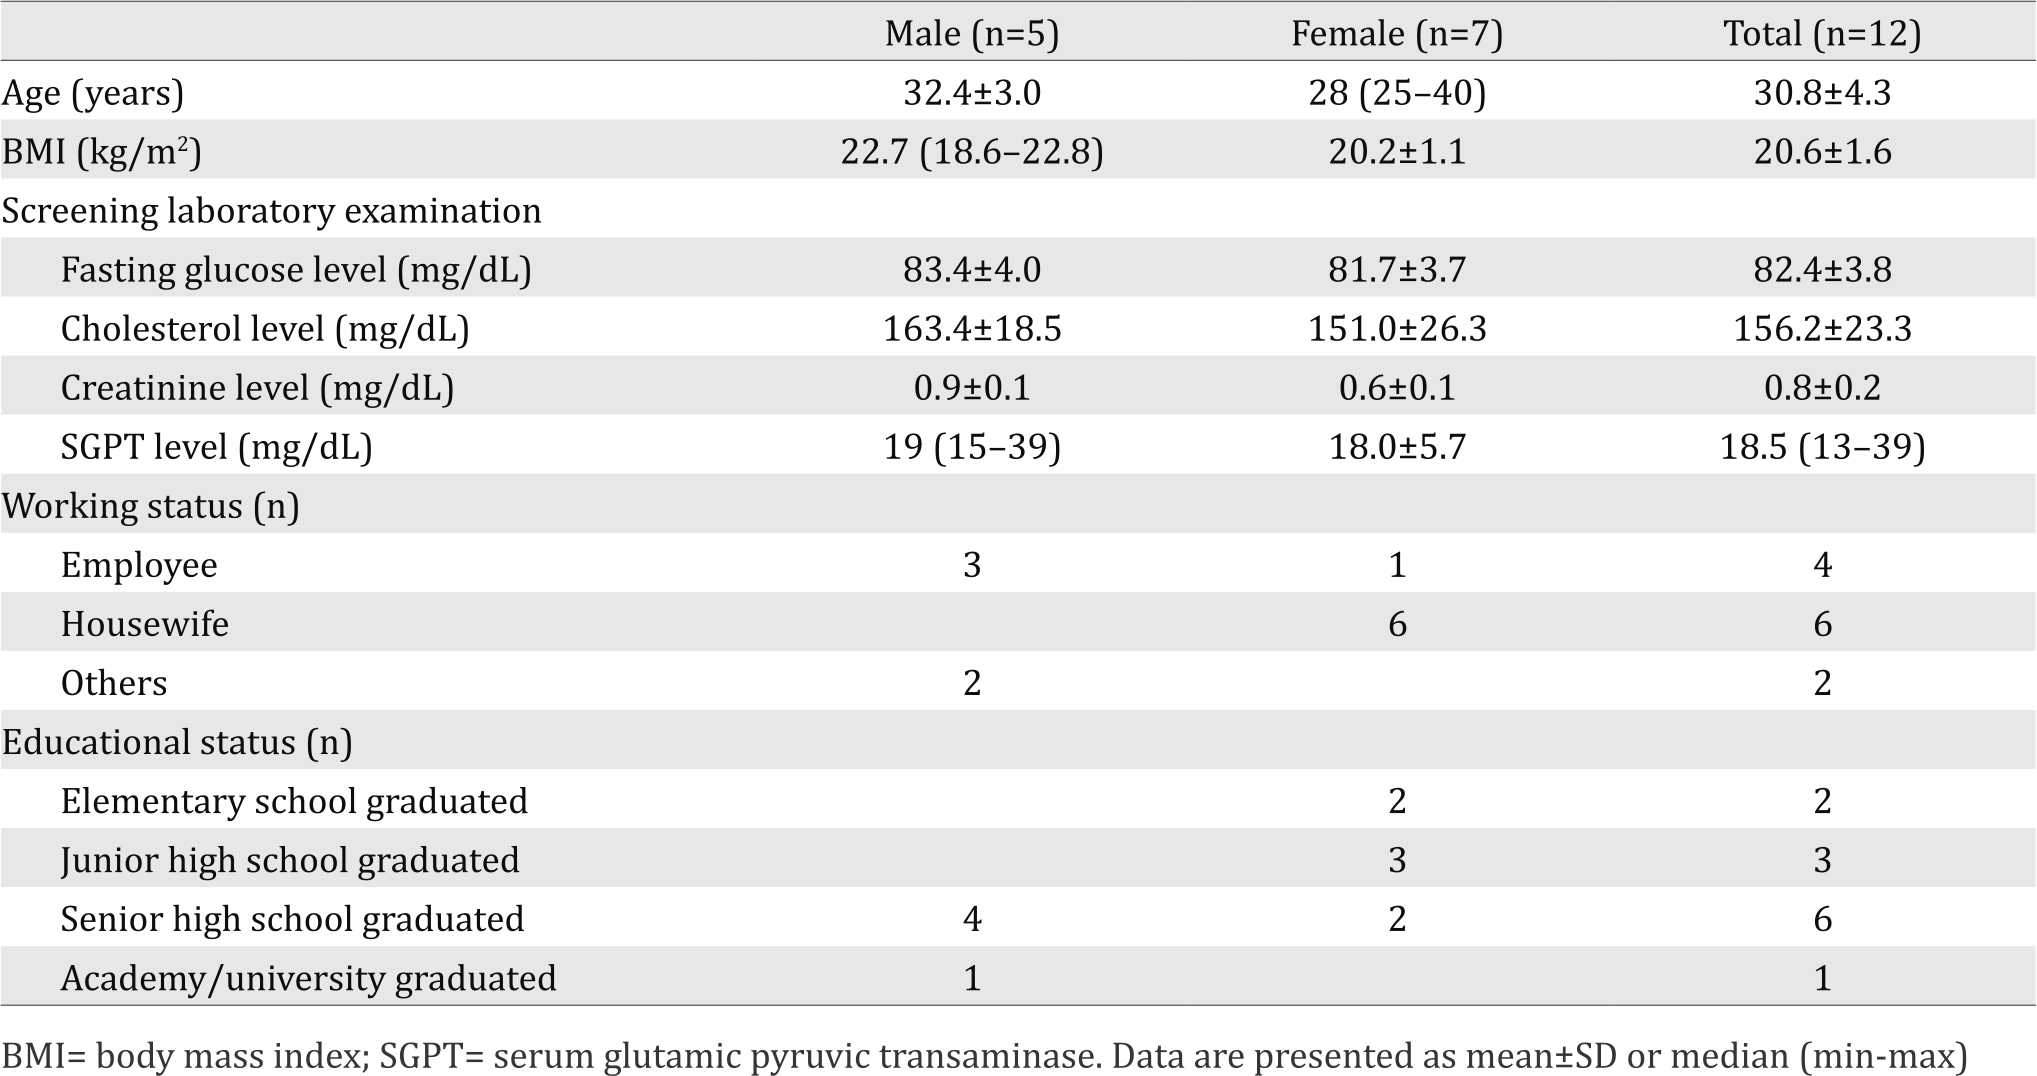
From 12 recruited subjects, seven of the subjects were females. Average age of all the subjects was 30.8±4.3 years old with average BMI of 20.6±1.6 kg/m2. Most of female subjects were housewives and most of male subjects were employees with senior high school graduated education. The subjects’ characteristics can be seen in Table 2.
Table 2. Characteristics of subjects
The postprandial blood glucose were different significantly between the two snacks at baseline, 30 minutes, and 120 minutes after meal. The serum insulin level was significantly difference at 30 minutes after meal between the two snacks. Furthermore, there were significantly differences between the two snacks in VAS of hunger and satiety at 180 minutes after meal. In addition, area under the curve of glycemic response of fiber-rich milk was significantly lower than the equi-carbohydrate snack (p=0.010). Table 3 shows the results of postprandial blood glucose and insulin response, satiety and hunger feeling of each test snack.
Table 3. Postprandial glycemic and insulin response, satiety and hunger feeling after consuming fiber-rich milk and equi-carbohydrate snack
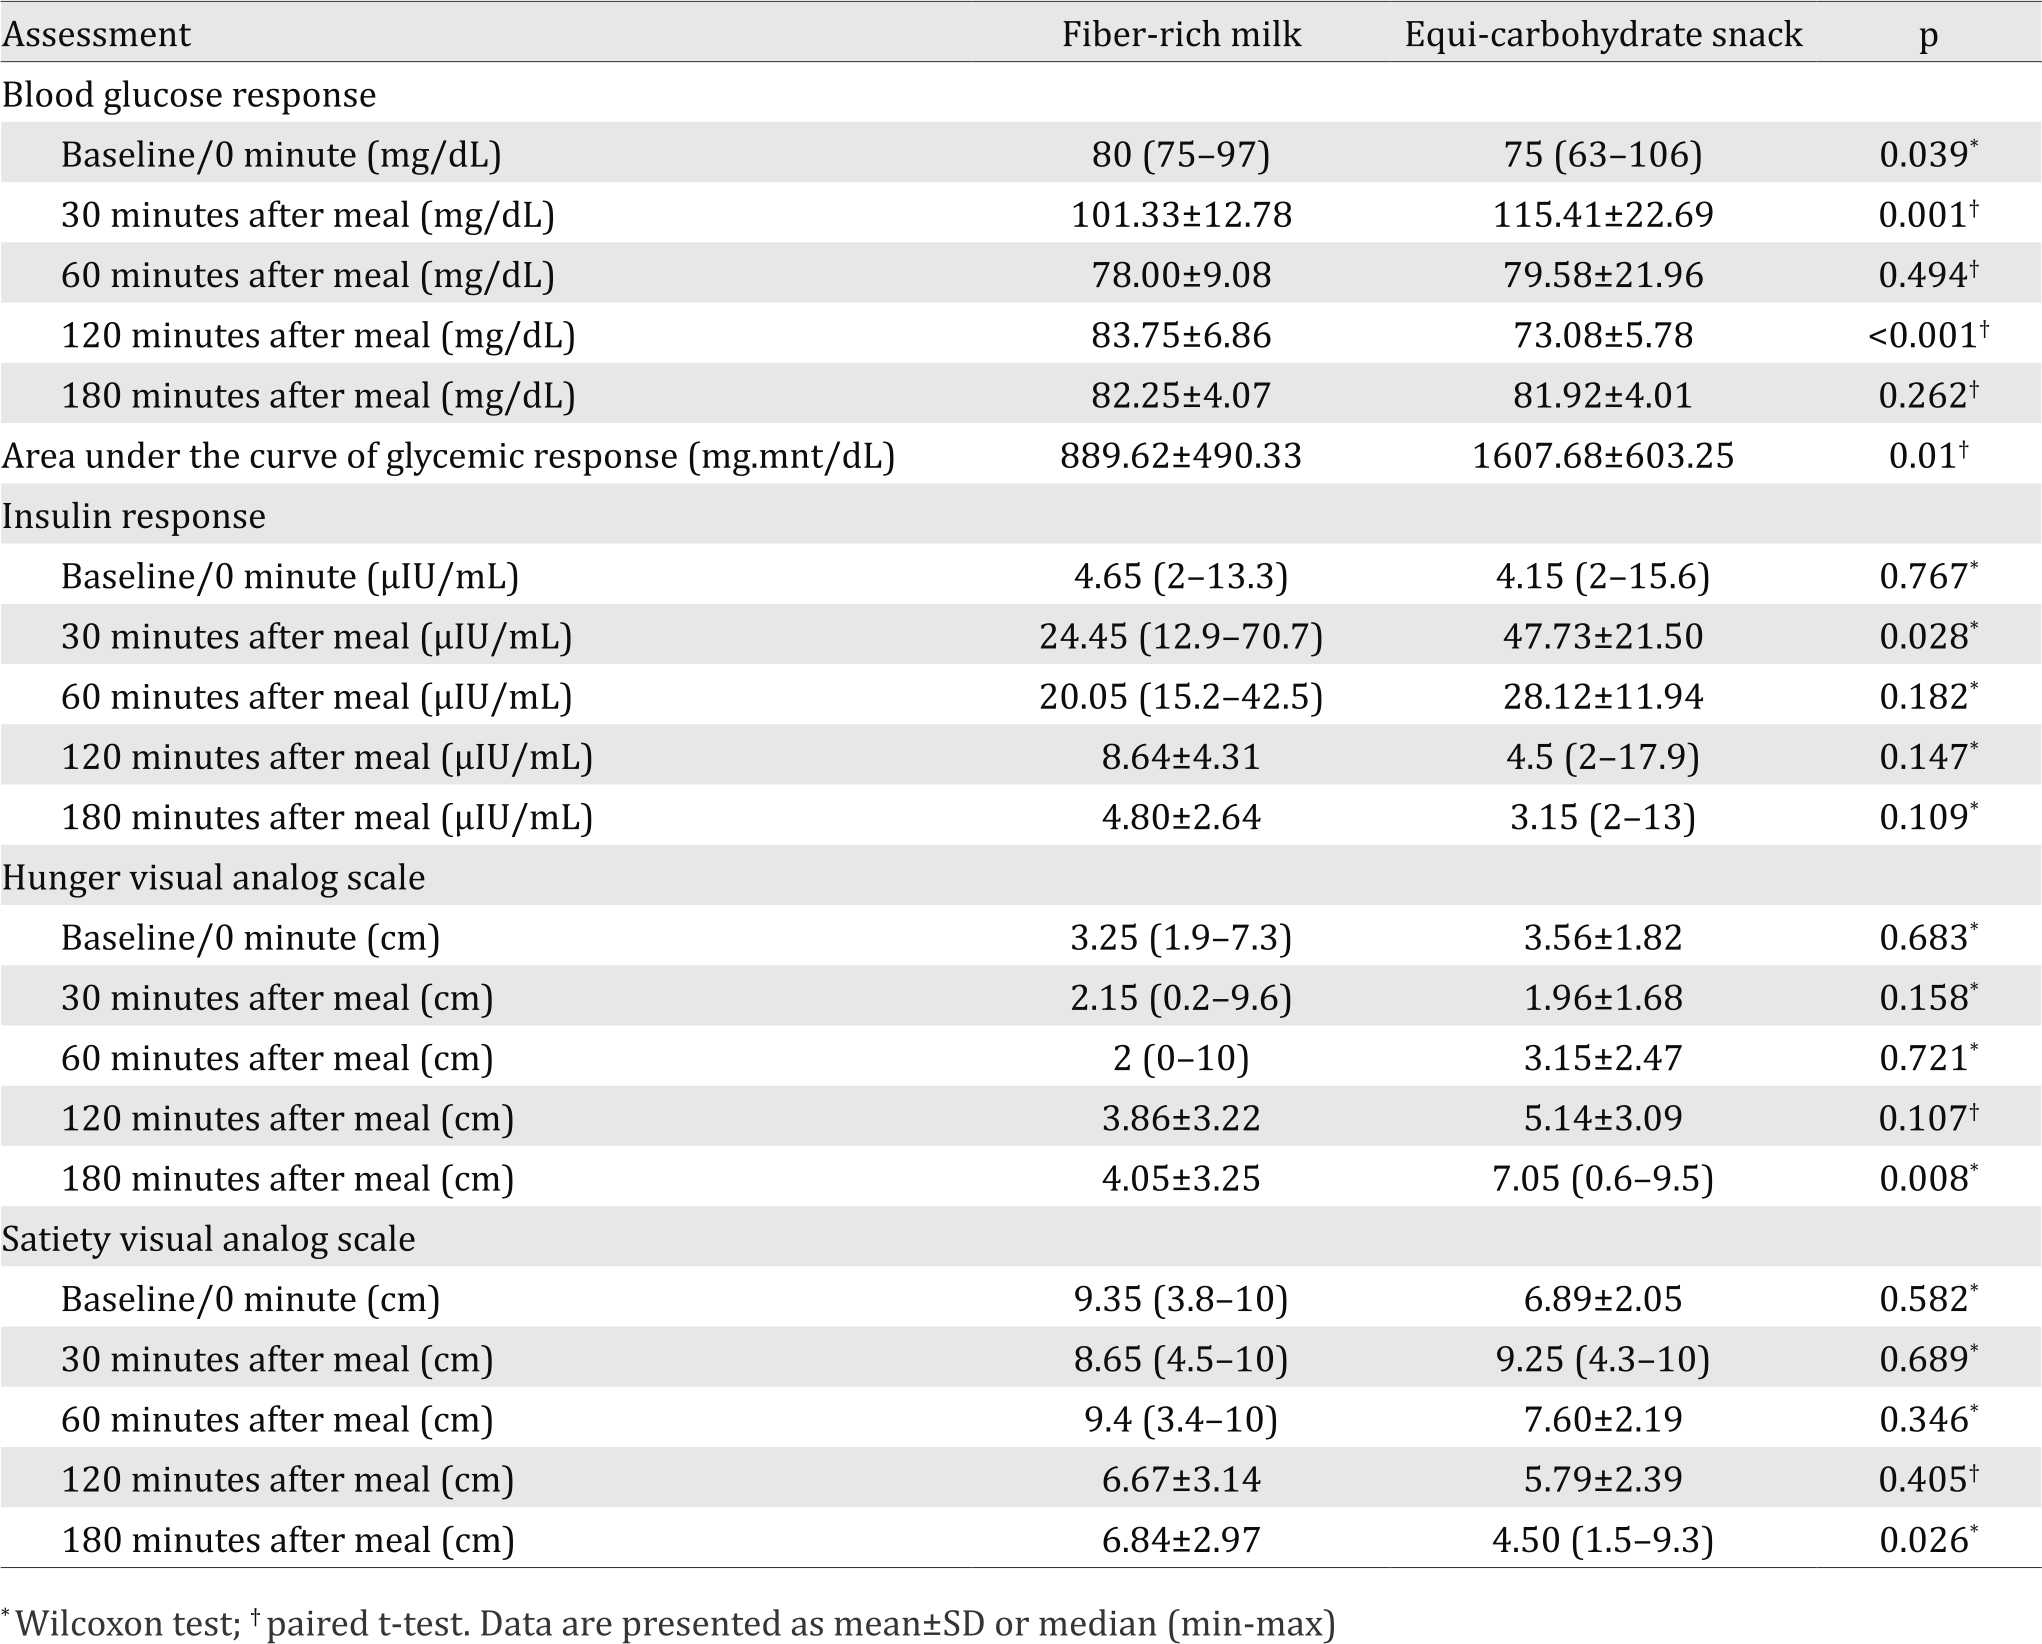
In this study, the pattern of the postprandial glycemic (p<0.001) and insulin (p=0.045) response were significantly different between the fiber-rich milk and equi-carbohydrate snack as shown in the Figures 2 and 3. The shape of the glucose response after consuming the fiber-rich milk was biphasic compared with the monophasic shape of the equi-carbohydrate snack. The peak of the blood glucose level in postprandial glycemic response at 30 minutes after meal was significantly lower after consuming the fiber-rich milk as compared to the equi-carbohydrate snack (p=0.001). There was no hypoglycemic episode after consuming fiber-rich milk. The same pattern was also shown for the postprandial insulin response. The highest insulin concentration after consuming the fiber-rich milk at 30 minutes after meal was significantly lower than after consuming an equi-carbohydrate snack (p=0.028).
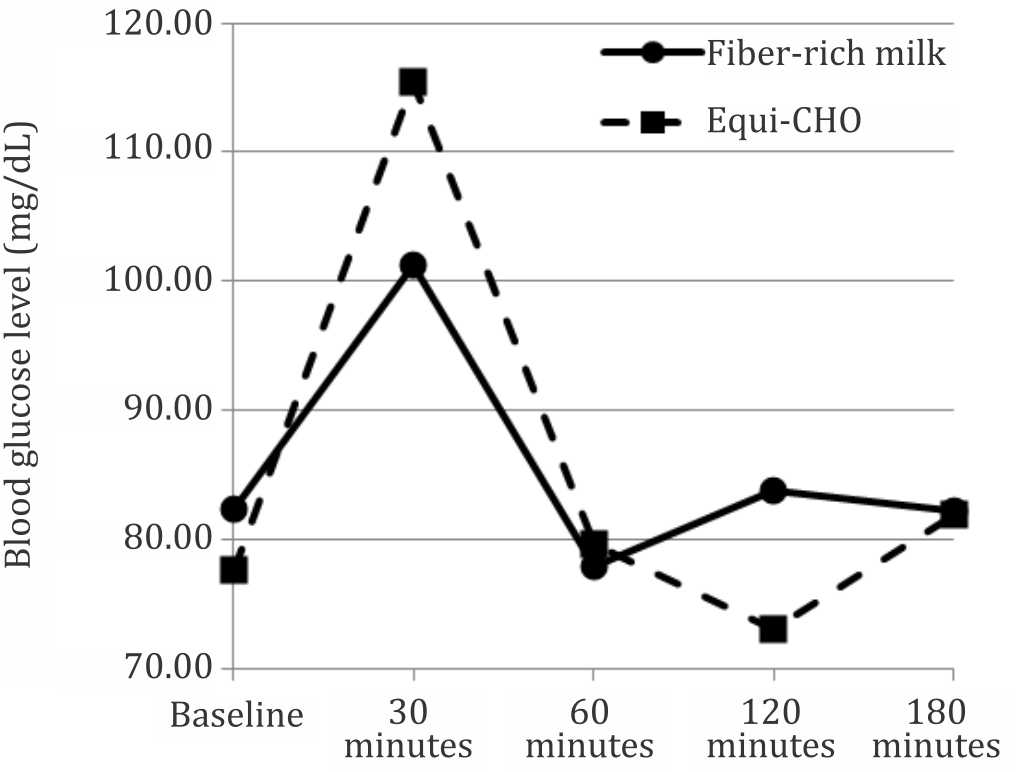
Figure 2. Blood glucose response pattern over time between two foods (p<0.001 using general linear model-multiple measures ANOVA statistical analysis)
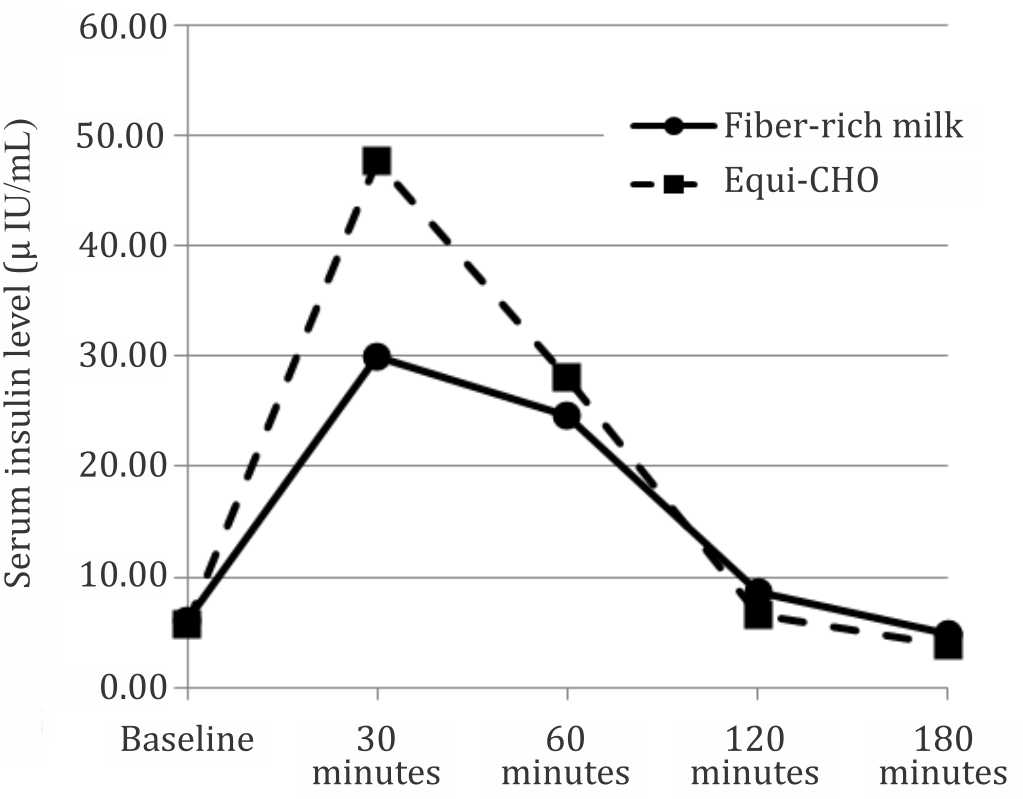
Figure 3. Serum insulin response pattern over time between two foods (p=0.045 using general linear model-multiple measures ANOVA statistical analysis)
Figures 4 and 5 show patterns of the postprandial hunger and satiety feeling over three hours testing time. There was a significant difference between patterns of the hunger feeling after consuming the fiber-rich milk and equi-carbohydrate snack (p=0.021). There was no significant difference between patterns of satiety feeling between two test snacks (p=0.357). The patterns show that subjects’ hunger and satiety feeling were stable and there was no surge of hunger during the three hours testing period in the fiber-rich milk intervention.
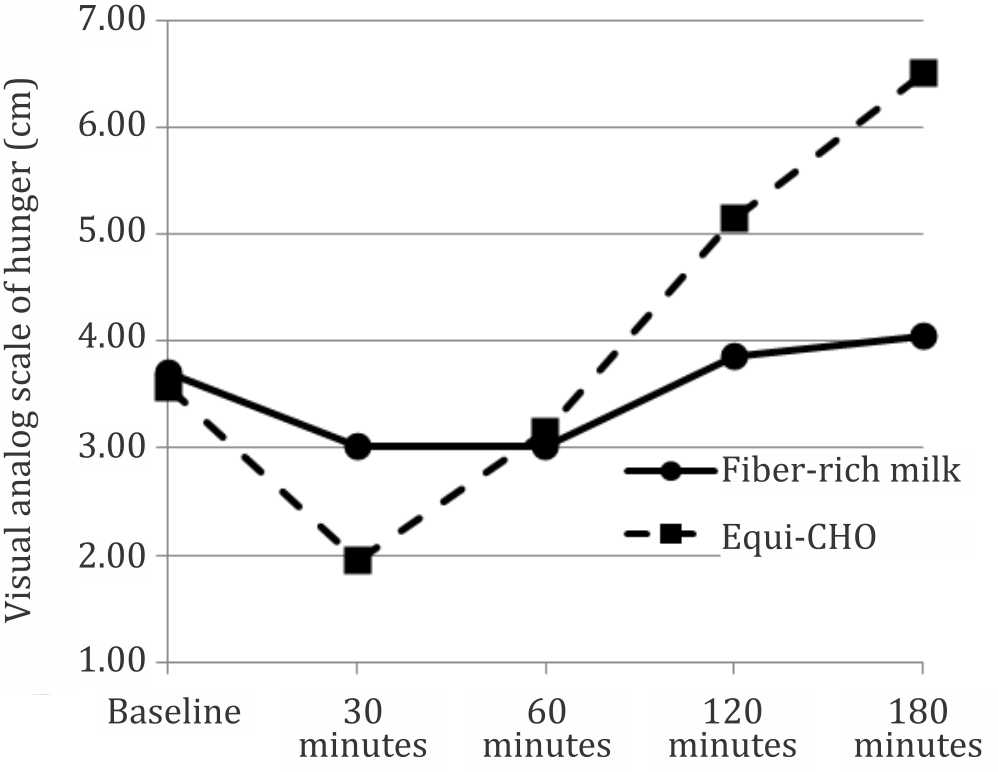
Figure 4. Hunger feeling pattern over time between two foods (p=0.021 using general linear model-multiple measures ANOVA statistical analysis)
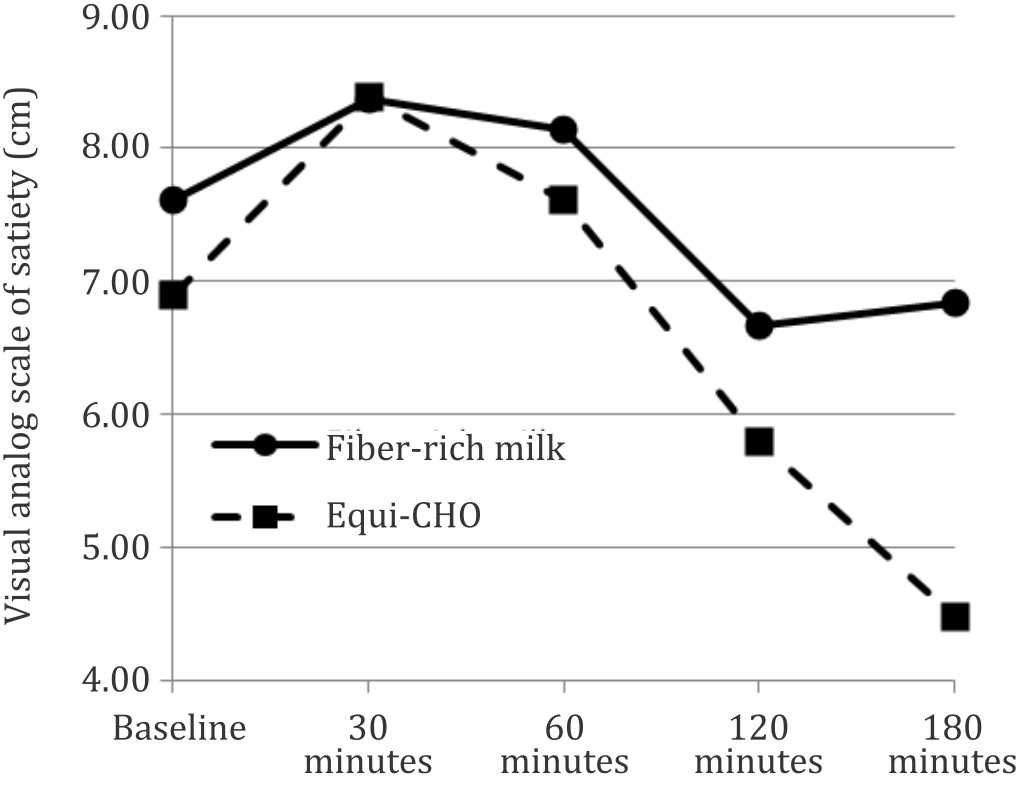
Figure 5. Satiety feeling pattern over time between two foods (p=0.357 using general linear model-multiple measures ANOVA statistical analysis)
DISCUSSION
This study shows that the glycemic response of the fiber-rich milk was lower than the equi-carbohydrate snack. This is related to the low GI value of 30 for the dairy products,19 however, sweetener can increase the GI value of dairy products which are otherwise a low GI food. Brand-Miller et al18 concluded that dairy product containing maltodextrins, corn or glucose syrups that can increase the GI by more than two folds, and glycemic load (GL) by seven folds compared to milk powders with no added carbohydrates. Thus, the result of this study is aligned with the product composition, i.e. fiber-rich milk without added sugar.
In adults, the pattern of the glycemic response independently predicts the risk of type 2 diabetes. The incidence of type 2 diabetes can be reduced by decreasing insulin demand. A diet that produces higher blood glucose concentration and greater demand for insulin would increase the risk of type 2 diabetes.20 The shape of glucose curve during an oral glucose tolerance test (OGTT) can be used to identify metabolic dysregulation and the potential risk for future type 2 diabetes. Individual with a monophasic response (inverted U shape) exhibit greater insulin resistance and decreased β-cell function compared with individuals with a biphasic response (a second rise of plasma glucose after first decline).21 In this study, the glycemic response pattern in the fiber-rich milk product was a biphasic response compared with the inverted U shape in the equicarbohydrate snack.
Serum insulin response pattern after consuming fiber-rich milk was significantly different as compared with the equi-carbohydrate snack, with lower peak. This finding was different as compared to Hoyt et al22 that dairy product (skimmed and whole milk) may increase serum insulin response. However, this result corresponded with the data of glycemic index foods that lactose as the source of carbohydrate has a low glycemic index with lower peak of insulin response as compared with glucose.23
Many studies have been conducted to analyze the relationship between glycemic index and satiety with inconsistent results. Some studies found no effect of low GI food to suppress hunger while others found a significant increased in satiety feeling after consumption of the low GI diets. A review article by Bornet et al24 found that 12 out of 18 studies supported an inverse relationship between GI diets and satiety, and concluded that low glycemic index food produces high satiety feeling. This study showed no siginificant difference in the satiety and hunger feeling before consumption of the two snacks, and there was no significant difference in the satiety feeling after consumption between the two snacks. However, the hunger feeling after consumption was significantly different. LaCombe et al7 in their study found a significant difference between hunger scores before lunch in children four hours after consumption of breakfast meals differing in GI, indicating children were hungrier in the high GI group compared to the low GI group. No significant difference was observed between satiety scores after breakfast.
In conclusions, this study found that there are significant differences of the glycemic response, insulin response, and hunger feeling after consuming the fiber-rich milk compare with an equi-carbohydrate food. Thus, fiber-rich milk can be used as an alternative for snack in healthy adults to maintain stability of glycemic and insulin response to prevent the risk of type 2 diabetes, also to support diet program for those who tend to have a surge of hunger. However, there is still a need for further study using the fiber-rich milk as compare with milk without fiber as an alternative for snack to support blood glucose management in pre-diabetic patients for a longer period of time.
Conflicts of Interest
Chandra and Bardosono reported grants from PT. Sasanacitta Husada during the conduct of the study.
Acknowledgment
The authors wish to thank Stella Evangeline Bela and Hayfa Husain for technical assistance in the study.
REFERENCES
- Sadler M. Food, glycaemic response and health. Brussels: International Life Sciences Institute Europe; 2011. p. 10–18. Indonesian.
- Livesey G, Taylor R, Hulshof T, Howlett J. Glycemic response and health--a systematic review and meta-analysis: relations between dietary glycemic properties and health outcomes. Am J Clin Nutr. 2008;87(1):258S–68.
- Badan Penelitian dan Pengembangan Kesehatan. Riset kesehatan dasar. Jakarta: Kementerian Kesehatan Republik Indonesia, 2013. p. 87–8. Indonesian.
- Liu Z, Fu C, Wang W, Xu B. Prevalence of chronic complications of type 2 diabetes mellitus in outpatients - a cross-sectional hospital based survey in urban China. Health Qual Life Outcomes. 2010;8:62–70.
- Litwak L, Goh SY, Hussein Z, Malek R, Prusty V, Khamseh ME. Prevalence of diabetes complications in people with type 2 diabetes mellitus and its association with baseline characteristics in the multinational A1chieve study. Diabetol Metab Syndr. 2013;5(1):57–66.
- Galgani J, Aguirre C, Díaz E. Acute effect of meal glycemic index and glycemic load on blood glucose and insulin responses in humans. Nutr J. 2006;5:22–8.
- LaCombe A, Ganji V. Influence of two breakfast meals differing in glycemic load on satiety, hunger, and energy intake in preschool children. Nutr J. 2010;9:53–8.
- Slavin JL. Position of the American Dietetic Association: health implications of dietary fiber. J Am Diet Assoc. 2008;108(10):1716–31.
- Carroll JF, Kaiser KA, Franks SF, Deere C, Caffrey JL. Influence of BMI and gender on postprandial hormone responses. Obesity (Silver Spring). 2007;15(12):2974–83.
- Basu R, Dalla Man C, Campioni M, Basu A, Klee G, Toffolo G, et al. Effects of age and sex on postprandial glucose metabolism: differences in glucose turnover, insulin secretion, insulin action, and hepatic insulin extraction. Diabetes. 2006;55(7):2001–14.
- Yu K, Ke MY, Li WH, Zhang SQ, Fang XC. The impact of soluble dietary fibre on gastric emptying, postprandial blood glucose and insulin in patients with type 2 diabetes. Asia Pac J Clin Nutr. 2014;23(2):210–8.
- Seino S, Shibasaki T, Minami K. Dynamics of insulin secretion and the clinical implications for obesity and diabetes. J Clin Invest. 2011;121(6):2118–25.
- Juvonen KR, Purhonen AK, Salmenkallio-Marttila M, Lähteenmäki L, Laaksonen DE, Herzig KH, et al. Viscosity of oat bran-enriched beverages influences gastrointestinal hormonal responses in healthy humans. J Nutr. 2009;139(3):461–6.
- Radulian G, Rusu E, Dragomir A, Posea M. Metabolic effects of low glycaemic index diets. Nutr J. 2009;8:5–12.
- Nilsson M, Holst JJ, Björck IM. Metabolic effects of amino acid mixtures and whey protein in healthy subjects: studies using glucose-equivalent drinks. Am J Clin Nutr. 2007;85(4):996–1004.
- Perkumpulan Endokrinologi Indonesia. Konsensus Pengelolaan dan Pencegahan Diabetes Melitus tipe 2 di Indonesia. Jakarta: Pengurus Besar Perkumpulan Endokrinologi Indonesia, 2015. p. 12. Indonesian.
- Venn BJ, Green TJ. Glycemic index and glycemic load: measurement issues and their effect on diet-disease relationships. Eur J Clin Nutr. 2007;61Suppl1:S122–31.
- Brand-Miller J, Atkinson F, Rowan A. Effect of added carbohydrates on glycemic and insulin responses to children’s milk products. Nutrients. 2013;5(1):23–31.
- Atkinson FS, Foster-Powell K, Brand-Miller JC. International tables of glycemic index and glycemic load values: 2008. Diabetes Care. 2008;31(12):2281–3.
- Barclay AW, Petocz P, Mcmillan-Price J, Flood VM, Prvan T, Mitchell P, et al. Glycemic index, glycemic load, and chronic disease risk--a meta-analysis of observational studies. Am J Clin Nutr. 2008;87(3):627–37.
- Abdul-Ghani MA, DeFronzo RA. Plasma glucose concentration and prediction of future risk of type 2 diabetes. Diabetes Care. 2009;32(Suppl2):S194–8.
- Hoyt G, Hickey MS, Cordain L. Dissociation of the glycaemic and insulinaemic responses to whole and skimmed milk. Br J Nutr. 2005;93(2):175–7.
- Augustin LS, Kendall CW, Jenkins DJ, Willett WC, Astrup A, Barclay AW, et al. Glycemic index, glycemic load and glycemic response: an International Scientific Consensus Summit from the International Carbohydrate Quality Consortium (ICQC). Nutr Metab Cardiovasc Dis. 2015;25(9):795–815.
- Bornet FR, Jardy-Gennetier AE, Jacquet N, Stowell J. Glycaemic response to foods: impact on satiety and longterm weight regulation. Appetite. 2007;49(3):535–3.
Copyright @ 2016 Authors. This is an open access article distributed under the terms of the Creative Commons Attribution-NonCommercial 4.0 International License (http://creativecommons.org/licenses/by-nc/4.0/), which permits unrestricted non-commercial use, distribution, and reproduction in any medium, provided the original author and source are properly cited.
mji.ui.ac.id