Section Abstract Introduction Methods Results Discussion Conflict of Interest Acknowledgment References
Clinical Research
A novel echocardiography formula for calculating predicted pulmonary vascular resistance in patients with mitral stenosis
pISSN: 0853-1773 • eISSN: 2252-8083
http://dx.doi.org/10.13181/mji.v25i2.1405 Med J Indones. 2016;25:76–84
Received: March 10, 2016
Accepted: May 22, 2016
Author affiliation:
1 Department of Cardiology and Vascular Medicine, Faculty of Medicine, Universitas Indonesia, National Cardiovascular Center Harapan Kita, Jakarta, Indonesia
2 Department of Community Medicine, Faculty of Medicine, Universitas Indonesia, Cipto Mangunkusumo Hospital, Jakarta, Indonesia
Corresponding author:
Amiliana M. Soesanto
E-mail: amiliana14@ui.ac.id
Background
Pulmonary vascular resistance (PVR) plays an important role in the natural history, prognosis, and outcome after valve intervention in patients with mitral stenosis (MS). The existing formula to estimate PVR by means of echocardiography is not readily applicable in the MS patient subset because it does not specifically calculate the risk of PVR in MS. The aim of this study was to find a new echocardiography formula to estimate PVR in MS.
Methods
This diagnostic study was conducted in 2 stages. In the first stage, 58 consecutive subjects with MS were studied to find some model formulas for estimating PVR by multiple regression. Eight echo parameters were analyzed to seek their correlation with the invasive PVR value as a gold standard. The formula that had the best correlation and was easiest to use would be selected. In the second stage, those model formulas were validated by applying them to a further 34 consecutive MS subjects.
Results
Four formulas which gave a discriminator coefficient of r2 0.62–0.68 were derived. The best model formula was proposed for further application. The new selected formula PVR=-7.465+3.566 TRvmax –(0.23 TVs’)+6.799 (RV-MPI) showed good correlation (r=0.71, p<0.001) to the invasive PVR value, with good reliability. TRvmax is maximal velocity of tricuspid regurgitation, TVs’ is systolic velocity of tricuspid annulus, and RV-MPI is right ventricle index myocardial performance. ROC curve showed that the cut off point 7.2 has good sensitivity and specificity (90% and 88%, respectively) to predict PVR 7 WU.
Conclusion
This study has shown that a novel echocardiography formula can estimate PVR with good correlation and reliability in subjects with mitral stenosis.
Keywords
mitral stenosis, pulmonary hypertension, pulmonary vascular resistance
Rheumatic heart disease (RHD) remains a significant health problem in Asian and developing countries.1-3 It is a chronic sequelae of rheumatic carditis, which occurs in 60% to 90% cases of rheumatic fever caused by group A-hemolytic streptococcal infection of the throat. About 25% of all patients with RHD have isolated mitral stenosis, and about 40% have combined mitral stenosis (MS), and mitral regurgitation (MR).4 Pulmonary hypertension (PH) is known as a frequent complication of rheumatic mitral valve disease, including MS and MR. It influences the natural history of the disease, affects the response to treatment and alters the post-intervention prognosis.5 The mechanism of PH in valvular heart disease includes a passive increase of pulmonary vein pressure and reactive PH due to pulmonary arterial vasoconstriction. In reactive PH, there is increased pulmonary vascular resistance (PVR) due to pathological changes of pulmonary vasculature such as hypertrophy of intimamedia layer, plexiform lesion or hemosiderosis. These changes can be found in small number of patients with long-standing disease.5
PH is an indicator of disease severity in patients with MS and is one of the criteria for the timing of intervention.6 PH and PVR usually regress once the gradient across the stenotic mitral valve is relieved by either surgical or non-surgical intervention. However, in some patients with moderate and severe PH, pulmonary artery pressure and PVR remain significantly elevated despite the relief of mitral valve obstruction. Since patients with fixed PVR have a poorer prognosis, their identification is important.5
Right heart catheterization remains the standard by which PVR can be identified.7 However, this procedure carries certain risks due to its invasive nature. Therefore, some echocardiography studies proposed indexes to estimate PVR in cardiovascular disease, mostly in pulmonary arterial hypertension (PAH).8-10 Yet, none of them have been applied specifically in patients with MS. Considering that PVR is very important in managing patients with MS, and the pathophysiology of PH in MS is different from other etiologies of PAH condition, this study aimed to find a favorable echocardiographic formula for estimating PVR in MS.
METHODS
Patient population
Subjects were moderate or severe MS patients who had underwent right heart catheterization as part of their routine procedure of percutaneous trans-catheter mitral commissurotomy (PTMC).6 Diagnosis of moderate or severe MS was confirmed when Doppler echocardiography indicates the narrowing of mitral orifice area to ≤1.5 cm2 while the mean gradient is ≥5 mmHg.11,12 Subjects with concomitant significant aortic valve disease, congenital heart disease, poor echo window or whose ratio of heart rates in the two examinations (echocardiography and catheterization) exceeded 1.5 were excluded. All subjects underwent echocardiographic examination and right heart catheterization with the maximum time interval of six hours. Examinations were conducted in the echocardiographic laboratory and catheterization laboratory at National Cardiovascular Center (NCVC) Harapan Kita, Jakarta, from July 2009 to December 2011. The protocol of this study has been approved by Ethics Committee for Medical Research NCVC Harapan Kita and the Health Research Ethics Committee of the Faculty of Medicine, Universitas Indonesia (No. 267/PT02. FK/ETIK/2010).
A total of 119 consecutive patients were screened for inclusion in this study with the subsequent exclusion of 27 patients due to underage, heart rate ratio in the two examinations exceeding 1.5, echocardiography and catheterization interval exceeding six hours and poor echo window (Figure 1).
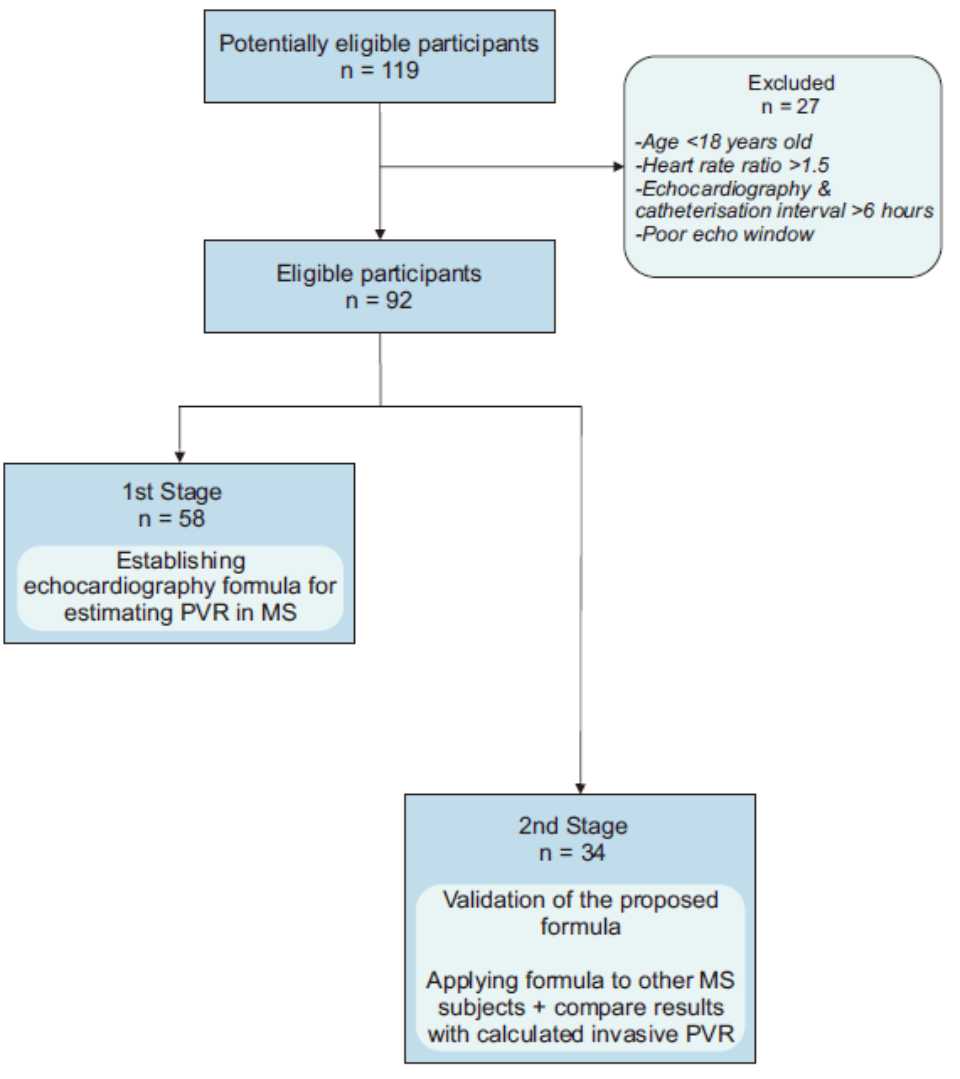
Figure 1. A diagram of patients recruitment
This study was conducted in two stages. The first stage was to establish some echocardiographic formula for estimating PVR in MS, followed by a second stage to validate the proposed formulas by applying them to other subjects with MS and comparing the results with calculated invasive PVR as a gold standard. The final study population included 58 subjects for the first stage and 34 subjects for the second stage.
Echocardiographic examination
Transthoracic echocardiography was performed in a left lateral decubitus position using a commercially echocardiography machine (vivid 7-dimension, general electric). Examinations were performed with a combined two-dimensional and Doppler echocardiography with a 5-MHz transducer. The sweep speed for Doppler-derived velocity and time interval measurements was 100 m/sec. The standard echocardiography examination was taken by either one of two well-trained senior cardiac sonographers. Some non-routine echocardiographic parameters for right heart hemodynamic profiles were obtained according to the protocol.13
Eight echo parameters as independent variables for the formula were specifically analyzed. They were mitral valve area (MVA) in cm2, mean mitral valve gradient (mMVG) in mmHg, tricuspid regurgitation maximum velocity (TRvmax) in m/ sec, pulmonary valve acceleration time (PV Acct) in m/sec, right ventricular outflow tract velocity time integral (RVOT VTI) in cm, right ventricle myocardial performance index in (RV-MPI), tricuspid annulus velocity (TVs’) in cm/sec, and 2-dimension speckle tracking for right ventricle global strain (RV strain) in %.
Mitral inflow continuous wave (CW) Doppler was obtained from the apical four chamber view by putting the ultrasound beam as parallel as possible with the mitral inflow turbulence jet during diastole. This spectral Doppler was used to calculate MVA (cm2) by pressure half time (PHT)14, and mMVG12 (mmHg) by tracing the spectral Doppler. Right ventricle outflow tract (RVOT) pulse wave (PW) Doppler was obtained by placing a PW Doppler sample volume in the proximal RVOT just before the pulmonary valve when imaged from the parasternal short-axis view. The sample volume was placed so that the minimal closing click of the pulmonary valve was visualized. This RVOT spectral Doppler was used to measure PV Acct (m/sec) by timing the early to peak wave, RVOT VTI (cm) by tracing the pectral Doppler), and pulmonary valve ejection time (PVET, in msec)15 by timing the early and end of the wave.
The tricuspid regurgitation (TR) Doppler signal was taken from the apical four chamber view or parasternal short axis view or right ventricle inflow view to get the most parallel jet turbulence to the ultrasound beam. The CW Doppler signal was used to measure TRvmax (mmHg) by measuring the peak velocity.16 RV-MPI was calculated by dividing isovolumetric time with RVOT ejection time [IVCT+IVRT]/PVET.17 Isovolumetric time was taken by measuring the time of TR jet flow. Tissue Doppler imaging of the right ventricle free wall was taken online to measure TVs’16 (in cm/sec) by measuring the peak systolic wave, and 2-D speckle tracking by offline analysis to measure peak RV strain.18 All echocardiographic parameters were digitally stored for further offline analysis.
The echocardiography result was evaluated offline by a single observer using a General Electric EchoPAC workstation. At least three cardiac cycles in sinus rhythm and five cardiac cycles in atrial fibrillation were calculated and averaged. Intra- and inter-observer variability was evaluated between two observers who were general cardiologists.
Invasive hemodynamic examination
Right heart catheterization for the invasive measurement of PVR was done during the PTMC procedure as part of the routine protocol. Cardiac interventionists who performed the invasive measurements were blind of the echocardiographic measurements and vice versa. Invasive PVR was calculated using the equation PVR = mPAp – mLAp/CO, where mPAp was mean pulmonary artery pressure, mLAP was mean left atrial pressure, and CO was cardiac output. Cardiac output was calculated using the Fick method and assumed oxygen consumption from the La Farge table.7 Mean PAp was measured directly from the catheter placed in the main pulmonary artery, while direct mLAp was measured with the catheter placed in the left atrium after the trans-septal puncture was done. The procedure and pressure measurements were done by one of our expert invasive cardiologists, and the measurements were calculated automatically from the pressure graphics. At least three cardiac cycles in sinus rhythm and five cardiac cycles in atrial fibrillation (AF) were calculated and averaged. To ensure the similarity in hemodynamic conditions and volume during echocardiographic and invasive examination, both procedures were performed within six hours without extensive volume loading, with the ratio of the heart rate not exceeding 1.5.
Statistical analysis
Patient characteristics data were presented in mean and 95% confidence intervals. Relationship between invasive PVR as the gold standard and eight echocardiography variables as independent variables were assessed by Pearson’s correlation coefficient for normally distributed data and Spearman Rho’s correlation coefficient for notnormally distributed data. Kolmogorov-Smirnov test was used to assess the normality of the distribution. Variables with correlation p value less than 0.25 were then included in multivariate analysis. We did not use more traditional p value levels such as 0.05, since it can fail in identifying variables known to be important.19,20 Multiple regression models with a backward method were constructed for invasive PVR and independent variables to establish some model formulas. From the second stage study, the correlation between invasive PVR as a gold standard and formulas were again assessed by Pearson’s or Spearman Rho’s correlation coefficient. Comparison between groups of mean invasive PVR versus mean echo formulas PVR and reliability test using Cronbach alpha were also done. Inter- and intra-observer variability were calculated using Pearson correlation.
To assess the diagnostic value of the novel formula, using PVR as the gold standard, receiver operating characteristic curves were plotted using a dichotomized function of PVR and a cut-off value of seven woods unit (WU). Several studies showed that PVR of >7 WU is associated with poor prognosis in surgically treated patients.21,22 Confidence interval of sensitivity and specificity were assessed. All analyses were performed on software (SPSS 17.0, SPSS Inc, Chicago, IL) and p<0.05 was considered as statistically significant.
RESULTS
The demographic and clinical characteristics of subjects in the first stage group and second stage group were homogenous, as shown in Table 1. The echocardiography parameters listed in Table 2 also showed similar characteristic. Figure 2 shows how the parameters were measured. A large proportion of subjects with AF were found.
Table 1. Subject’s characteristics
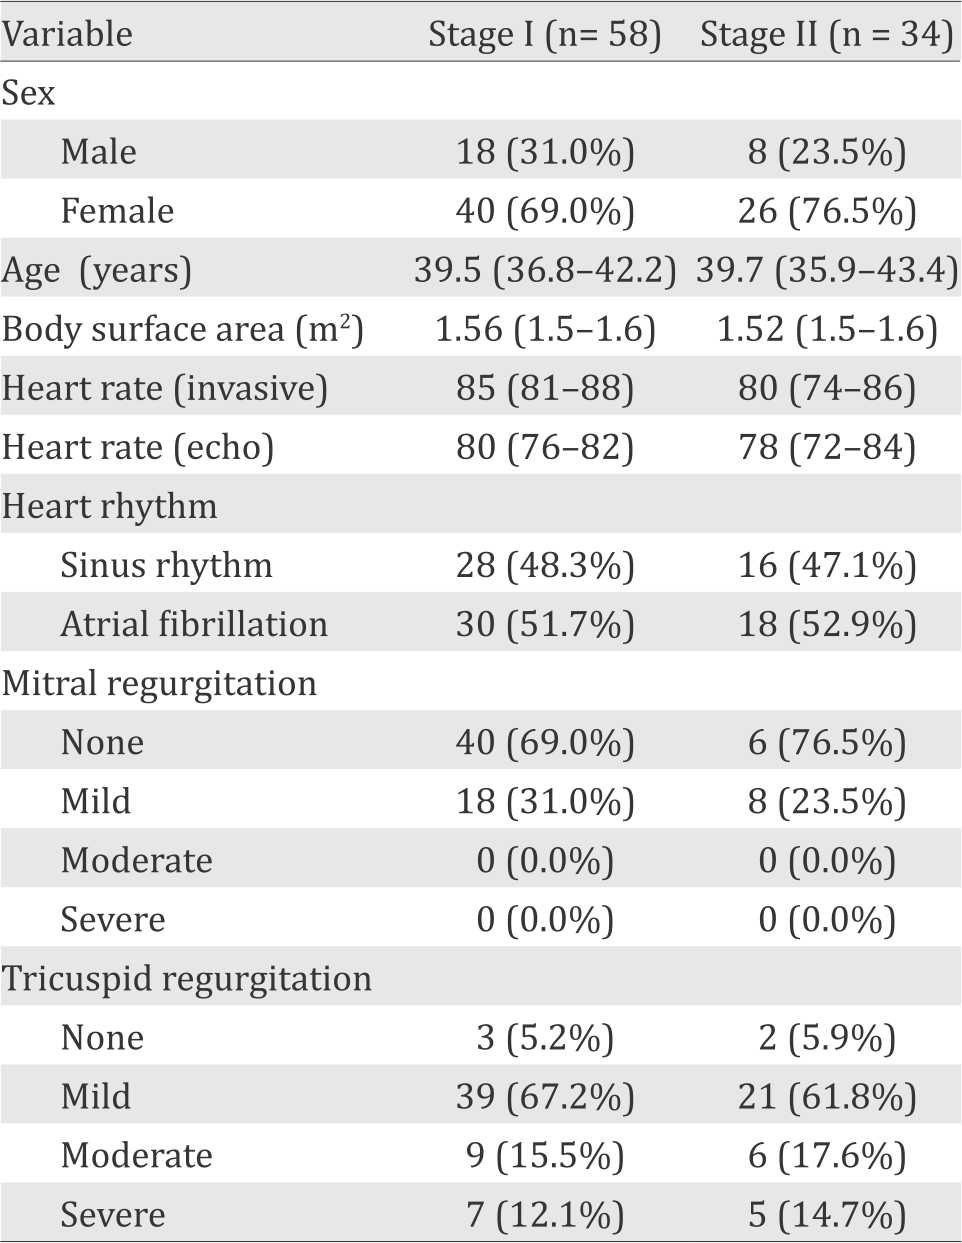
Table 2. Invasive and echocardiographic hemodynamic measurements
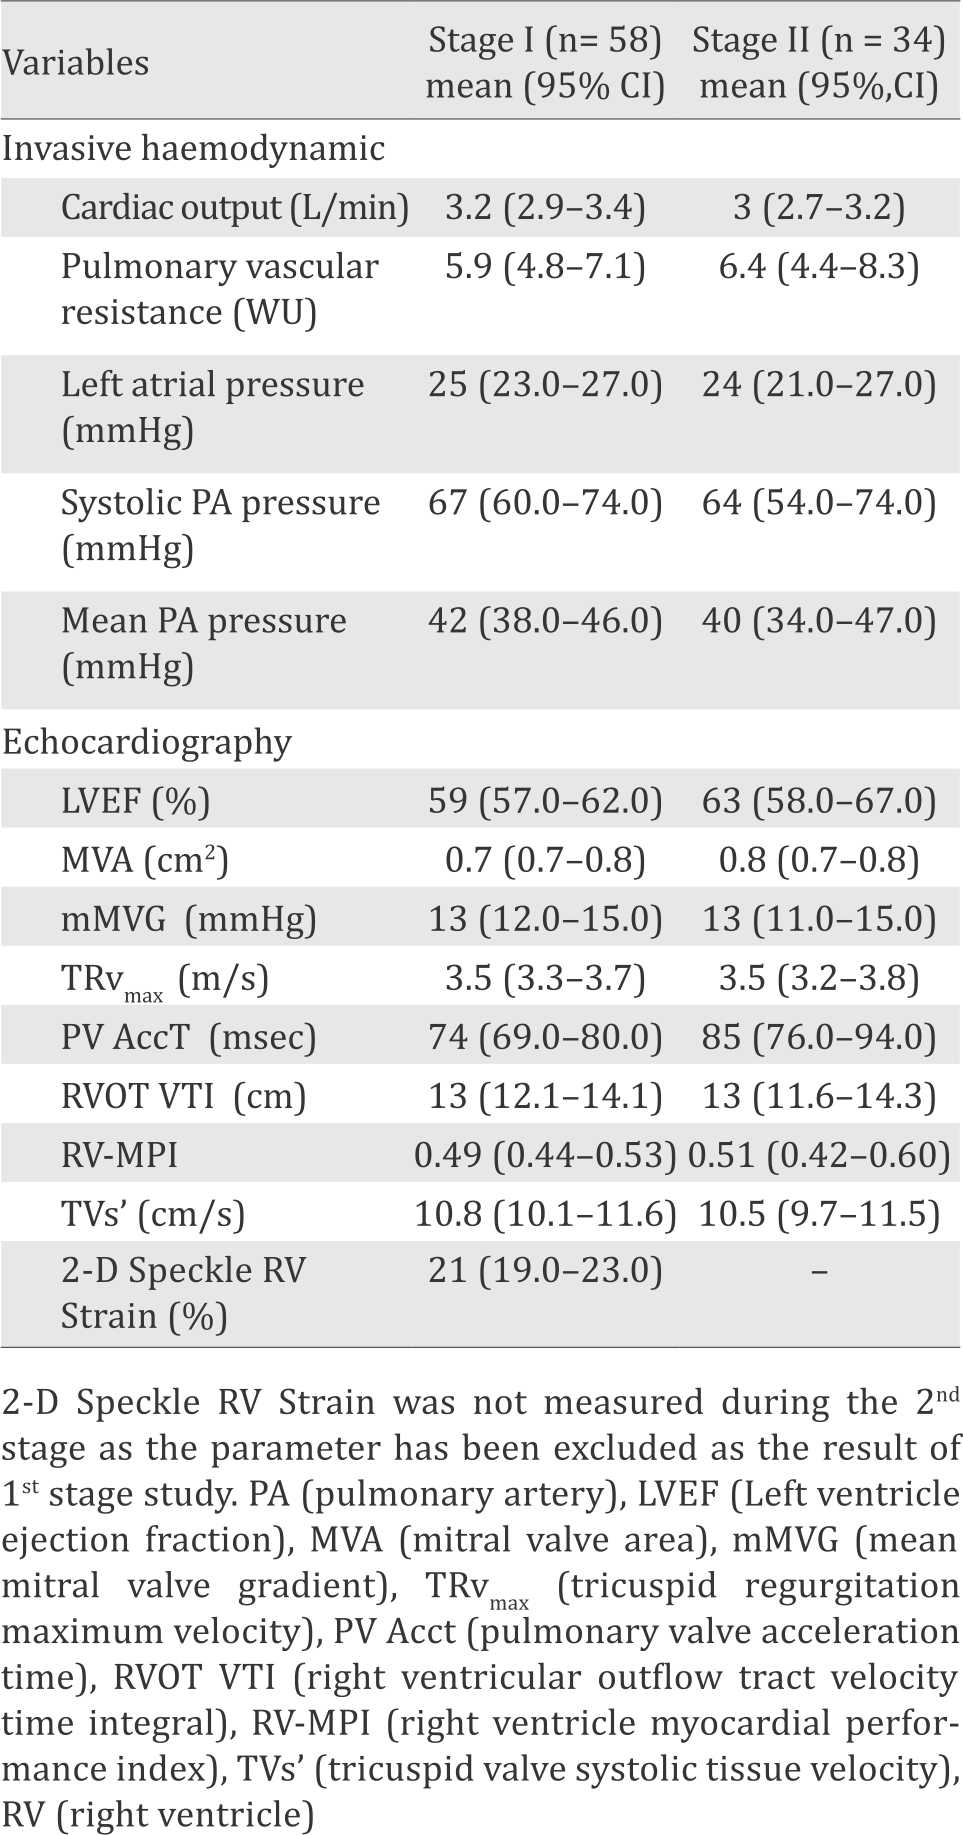
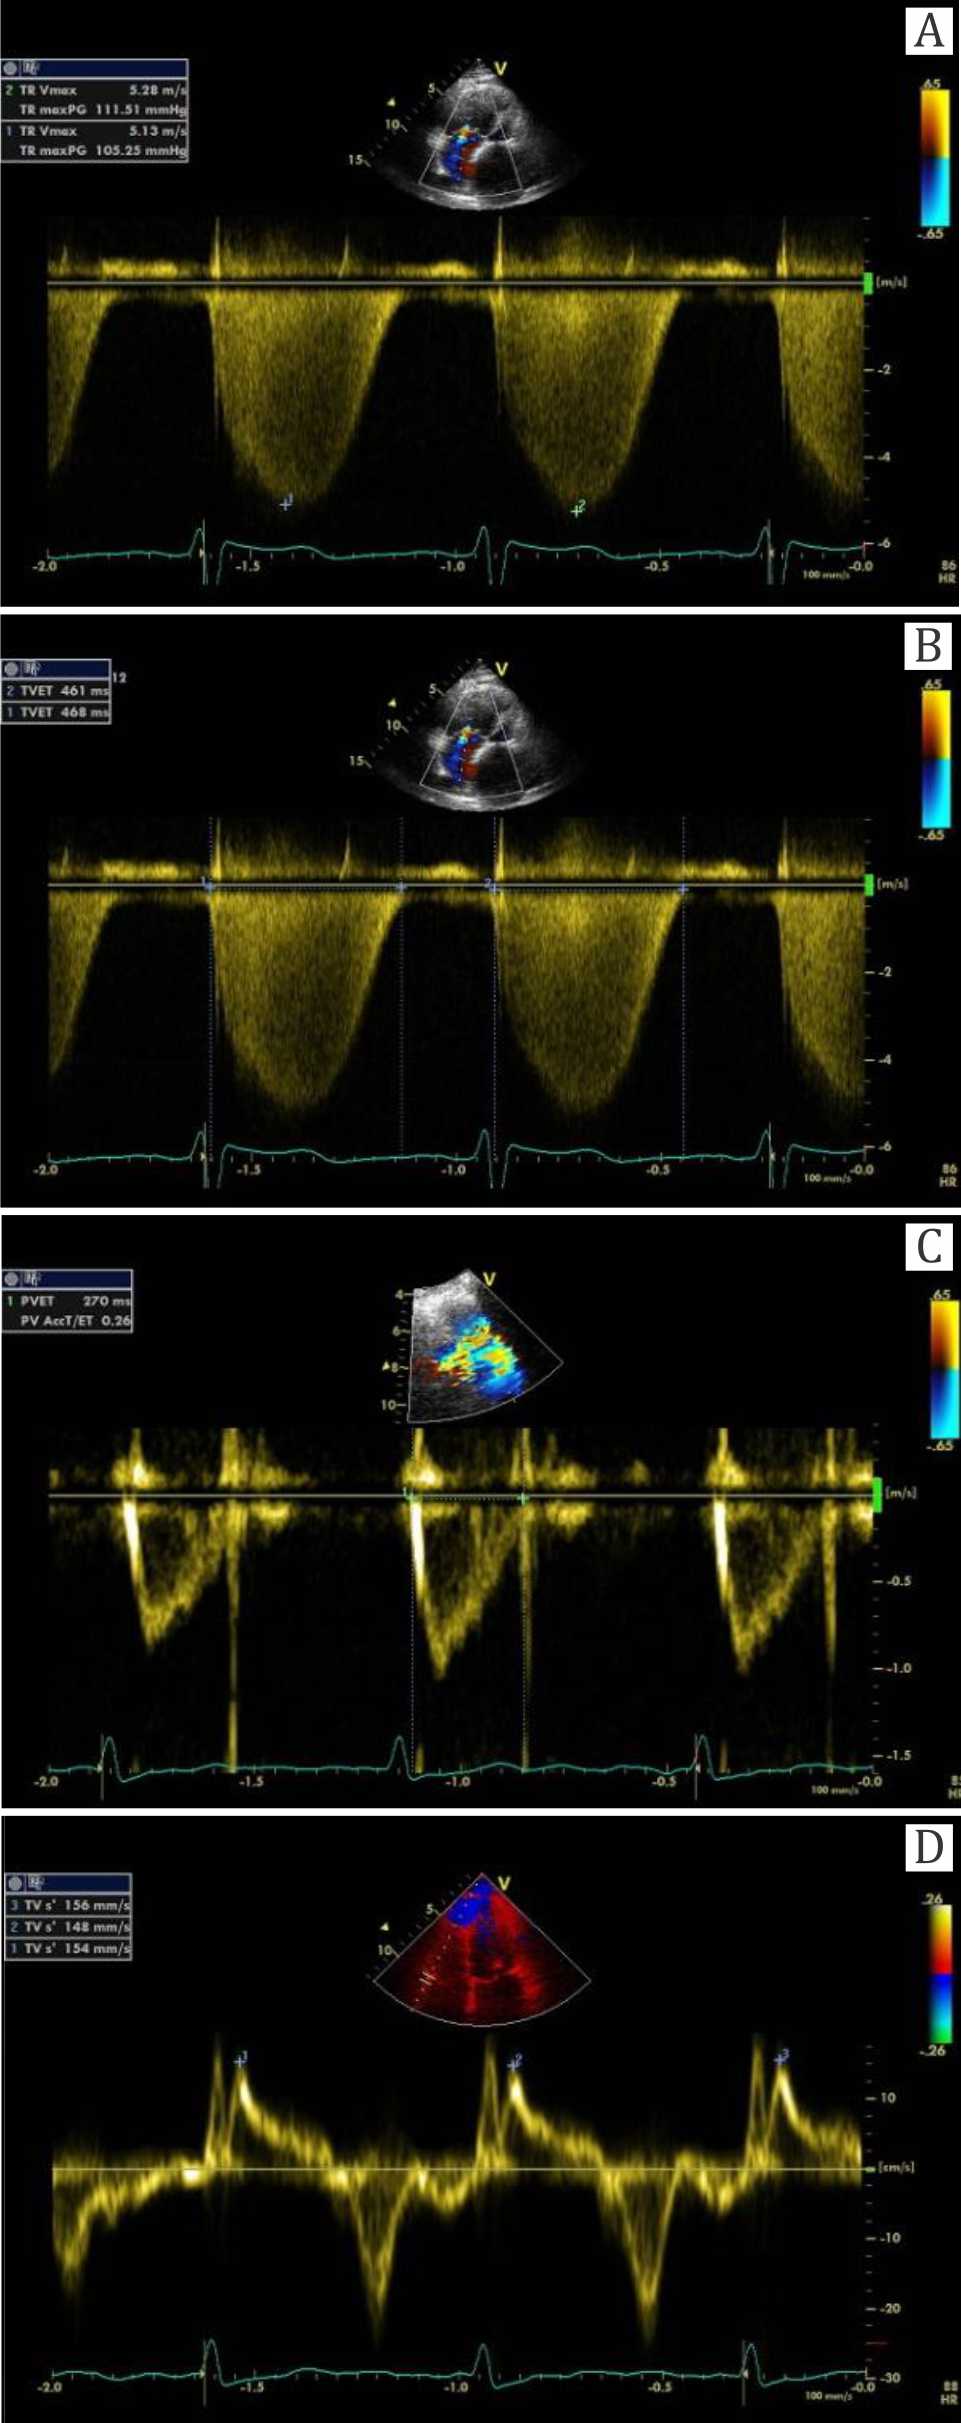
Figure 2. The measurement of the parameters with echocardiographic picture. (A) CW Doppler to measure TRvmax was taken by measuring the maximal velocity of tricuspid regurgitation in m/sec. (B,C) Right ventricular index myocardial performance (RV-IMP) is measured by (a-b) / b, whereas “a” was tricuspid ejection time in msec (picture B), and “b” was pulmonary valve ejection time in msec (C). (D) Spectral tissue Doppler measuring velocity of the tricuspid annulus on the site of free wall (TVs’ in cm/sec)
Building the formulas
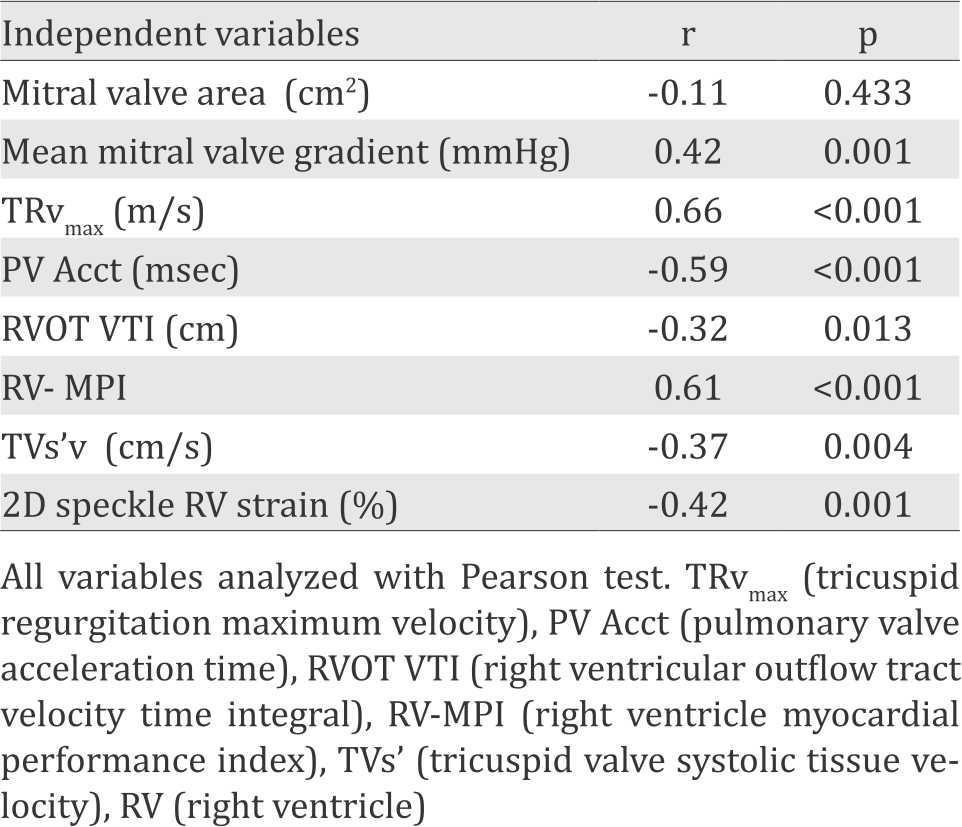
Table 3 displays the result of Pearson correlation test between eight echocardiography parameters and invasive PVR. Seven variables including mMVG, TRvmax, PV Acct, RVOT VTI, RV-MPI, TVs’, and 2D Strain showed correlation with p<0.25. Those seven variables were thus included in the multiple linear regression analysis.
Table 3. Correlation between echocardiographic parameters and invasive pulmonary vascular resistance (PVR)
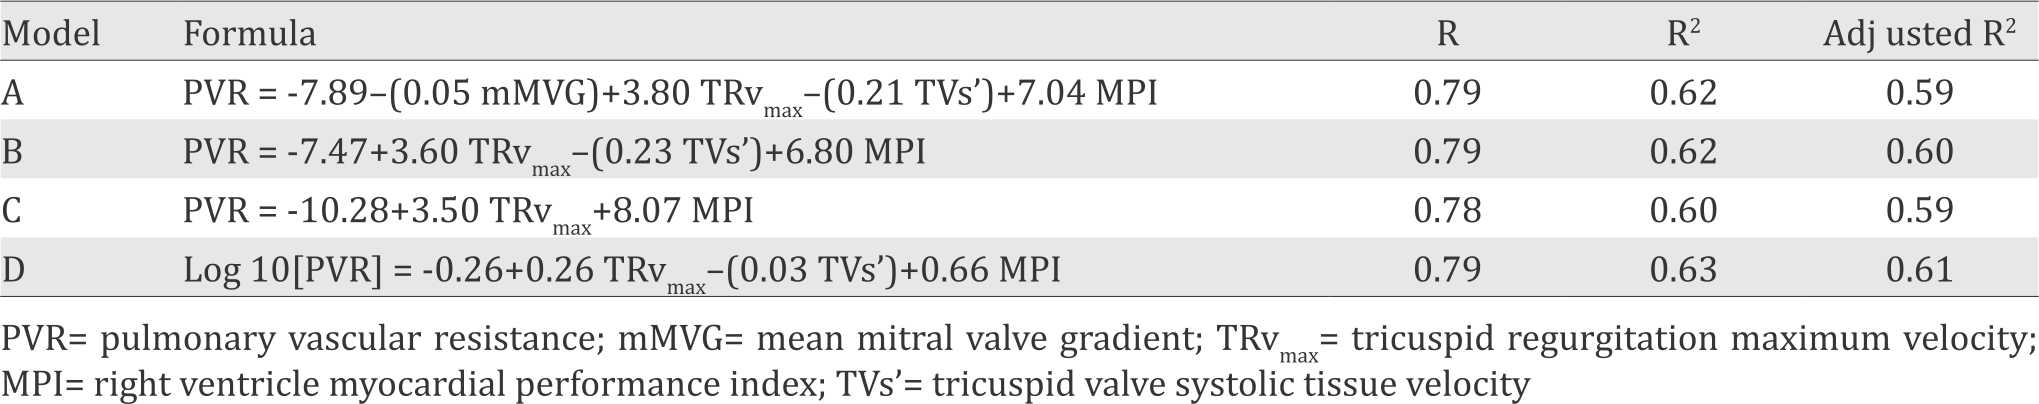
Four formulas with the best r2 from the multiple linear regression analysis were chosen to be evaluated further at the second stage study. Variables that were included in the model formulas were mMVG (mmHg), TRvmax (m/s), TVs’ (cm/s) and MPI. These four model formulas were shown in Table 4.
Table 4. Model formulas
Validation of the model formulas
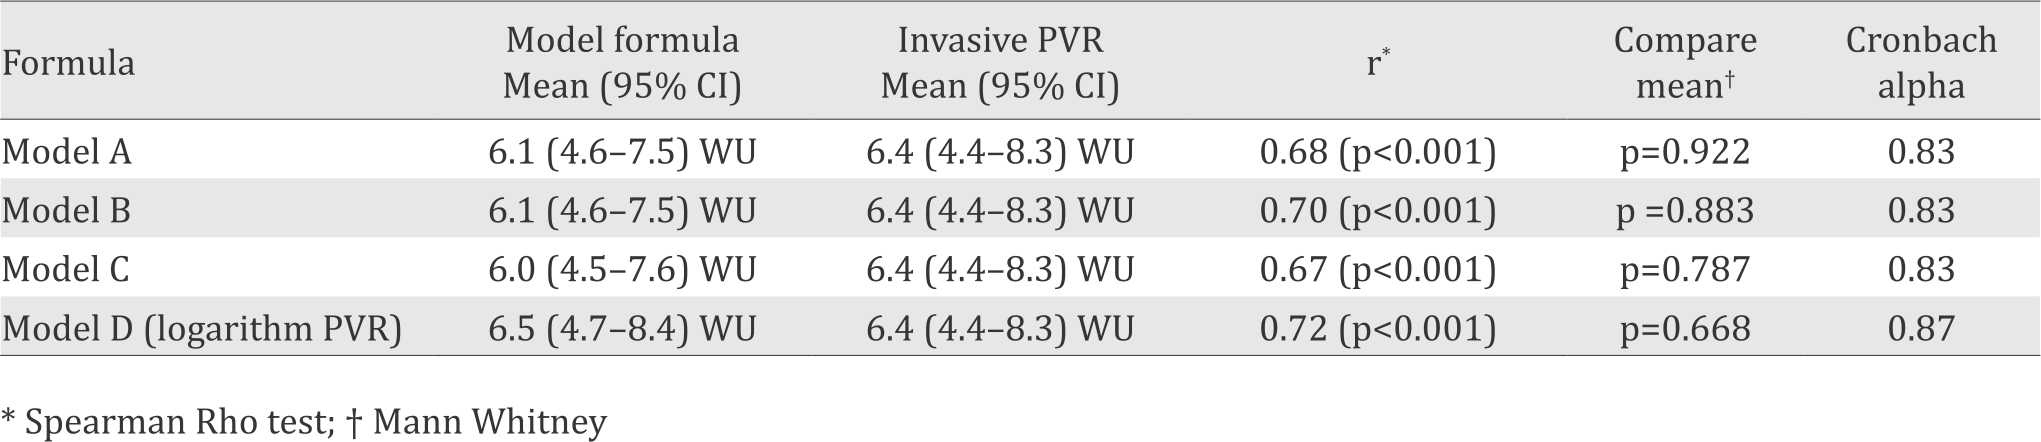
The correlation between invasive PVR and four model formulas was equally good (r=0.67-0.72) as shown in Table 5. There was no significant difference between mean invasive PVR group and mean calculated PVR derived from each of the four model formulas. Reliability tests using Cronbach alpha showed that all model formulas had good reliability (0.83).
Table 5. Comparison of the score calculated using model formula and invasive pulmonary vascular resistance (PVR)
Based on the correlation coefficient, the comparison test, the reliability test, and the practicality for daily use, formula B was selected as the most optimum formula. Since MPI is calculated by dividing the difference between tricuspid valve ejection time (TVET) and pulmonary valve ejection time (PVET) by PVET,23 so the practical form of this formula could be: PVR=-7.47 + 3.60 TRvmax – (0.23 TVs’) + 6.80 (TVET-PVET/PVET)
The receiving operator curve showed that the cut off point of 7.2 had good sensitivity and specificity (90% and 88%, respectively) to predict PVR 7 WU as shown in Figure 3.
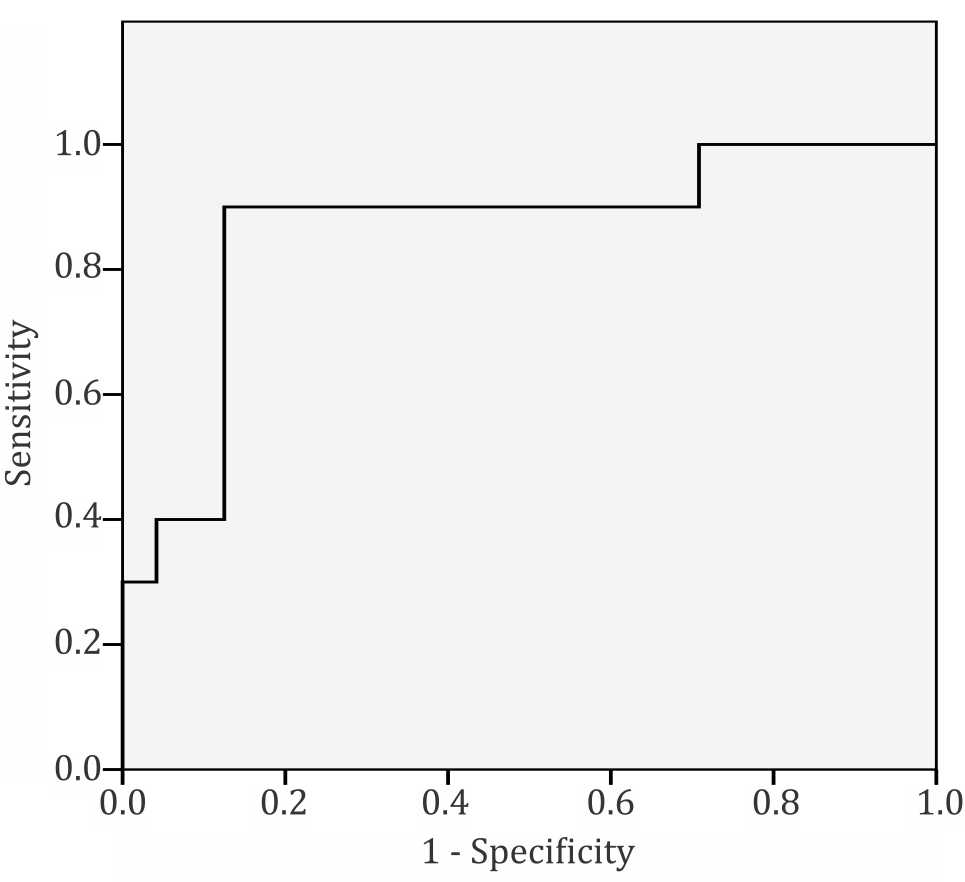
Figure 3. Receiver-operating characteristic curve. A cut off value of 7.2 provided the best balanced sensitivity (90%) and specificity (88%) to determine PVR ≥7 WU/m2
Intra- and inter- observer variability were 0.98 and 0.96 respectively.
DISCUSSION
This study demonstrated the novel formula of PVR as shown above can be used to estimate PVR in MS. Using a cut off point of 7.2 allowed the identification of PVR >7 WU with good accuracy.
Although several echocardiographic formulas to estimate PVR existed,8,9,24 none of them were built from valvular heart disease subjects, and in particular MS subjects. Most of the formulas were used in pulmonary arterial hypertensive patients. There are differences in the pathophysiology between those two entities. Mean LAp is much higher in MS patients compared to PAH patients. Since PVR calculation is [mPAp–mLAp]/CO, it is reasonable to question whether the previous indexes were suitable for estimating PVR in MS subjects.
The echocardiographic index for PVR described by Abbas has been included in the American Society of Echocardiography Guidelines for assessment of the right heart in adults.8 The index was calculated from selected etiological aspects of diseases (cardiac and non-cardiac), non-specific for MS patients. Thus, patient characteristics and disease etiologies are different from our study subjects.
Unlike other previous studies,8,9,24 instead of using pulmonary capillary wedge pressure (PCWP), we calculated invasive PVR through direct mLAp. In general, if obtained correctly, PCWP closely approximates LAp. However, in patients with mitral valve disease a significant error may be introduced by using a balloon-tipped floatation catheter for measuring PCWP.7 Significant TR commonly presents in patients with MS. Calculating CO by thermodilution method is inaccurate in the presence of significant TR.7 In order to reduce inaccuracy in measuring CO, the Fick method was used instead of the thermodilution method. Due to that reason, we believed that this study has chosen a favourable method to calculate invasive PVR as the gold standard in subjects with MS.
As also seen in this study, TRvmax was commonly used in earlier echocardiographic indices for estimating PVR.8,9,24 This variable is generally accepted to have a good correlation with pulmonary pressure.16 In this study, TR is presented in 95% of all MS subjects. A challenge occurred when the Doppler signal was too faint, as commonly found in trivial TR, so that peak velocity may be inaccurately obtained. Other problems occurred when there was a massive TR or very poor right ventricle (RV) contractility. All of the above conditions may cause underestimation of the TRvmax. The latter problem will be overcome by the fact that two variables of RV function were included in the new formula (i.e. TVs’ and RVMPI).
Although the variables in the new formula did not take into account all of the exact components in basic PVR calculation, a significant correlation still existed. It is because TRvmax represents pulmonary artery pressure, while TVs’ and RVMPI represent right ventricle function which also correlates with CO. Mean MVG, which can be assumed as a representation of mLAP, apparently did not improve the quality of the new formula. Perhaps this can be explained by the fact that increase LAp in mitral disease will be followed by a parallel increase of mPAp (passive PH); thus, the transpulmonary gradient is still normal or constant. However, in advanced mitral disease, pulmonary pressure can increase out of proportion, far beyond mMVG, and generate an elevated transpulmonary gradient (reactive PH) and the resulting increased PVR.25 That is the reason why PVR is more affected by increased pulmonary artery pressure than mMVG.
Previous studies included RVOT VTI in their indexes as a representation of CO.8,9,24 In this study, although there was a significant correlation between RVOT VTI and invasive PVR, this variable did not contribute well in the model formula using linear regression. On the contrary, TVs’ and RV-MPI which represent intrinsic and global function16 of RV, respectively, showed better correlation and a larger contribution in the new formula.
Severe longstanding PH and increase PVR in advance MS create pressure overload of the RV. In general, the RV adapts better to volume overload than to pressure overload. In contrast to volumeoverload states, moderate-to-severe acquired PH in the adult often leads to RV dilatation and failure. Pressure overload of the RV also may lead to RV ischemia, which may further cause ventricular dysfunction. Compared with volume-overload states, histological changes are more pronounced in RV pressure-overload states, as demonstrated by the increased density of myocardial connective tissue seen in both animal and human studies.26
In some patients with severe and progressive RV failure, pulmonary arterial pressure may decrease as a consequence of low cardiac output. Therefore, the interpretation of pulmonary pressure in patients with PH should always take into account the degree of RV failure and effective cardiac output.26 This reason may justifies the inclusion of TVs’ and RV-MPI variables in the novel formula.
There are some limitations in this study, including the practice of non-simultaneous echocardiographic examination and right heart catheterization for data comparison. Indeed, we have tried to minimize this source of error by performing the echocardiographic examination at a maximum of six hours before the right heart invasive measurements under comparable heart rate and volume condition. The proportion of AF in our subjects could also affect the result. To minimize this potential error, we measured and averaged five cardiac cycles for subject with AF.
Some echocardiographic parameters included in the formula are TRV, TVs’ and RV-MPI. Calculation of RV-MPI is based on two echocardiographic parameters namely TVET and PVET. The two measurements could not be obtained in one cardiac cycle. Condition like atrial fibrillation could affect the accuracy of the measurement. In patients with severe (massive) tricuspid regurgitation, the measurement of the peak velocity of the regurgitant jet could be an issue. Proper alignment of the Doppler ultrasound beam is a crucial factor to ensure adequate determination of TRV in this situation.
For clinical practice, this formula may provide a reliable, noninvasive method to determine PVR in MS patients which is still a challenge in developing countries. In addition, a cut off point that corresponds to a significant increase in PVR at the level of 7 WU could be clinically useful as an indicator of severity at the initial assessment of a patient with suggested PH.
In conclusion, the echocardiography estimation of PVR using the novel formula of PVR=-7.465 + 3.566 TRvmax – (0.23 TVs’) + 6.799 (RV-MPI) provides a useful estimation of PVR in patients with MS. Future prospective studies will be needed to validate these findings and to assess whether the novel formula is still apply for different groups of mitral valve disease patients and has role in the management strategies and further prediction of clinical outcome in patients with mitral valve disease after intervention procedures, especially mitral valve surgery.
Conflicts of Interest
The authors affirm no conflict of interest in this study.
Acknowledgment
Highest gratitude and appreciation are given to Prof. dr. Ganesja M. Harimurti, SpJP(K) as the Head of Department of Cardiology and Vascular Medicine when the study was conducted and Dr. dr. Hananto Adriantoro, SpJP(K), MARS as Director of National Cardiovascular Center Harapan Kita.
REFERENCES
- Carapetis JR. Rheumatic heart disease in Asia. Circulation. 2008;118(25):2748–53.
- who.int [Internet]. Rheumatic fever and rheumatic heart disease: report of a WHO Expert Consultation 2001. WHO Technical Report Series. [update 2004, cited 2012]. Available from http://www.who.int/ cardiovascular_diseases/resources/en/cvd_trs923.pdf
- Carapetis JR. Rheumatic heart disease in developing countries. N Eng J Med. 2007;357:439–41.
- Otto C, Bonow R. Valvular heart disease. In: Braunwald E, Libby P, Bonow R, Mann D, Zipes D, editors. Braunwald’s heart disease: a textbook of cardiovascular medicine. 8th ed. Philadelphia: Saunders Elsevier; 2008. p. 1646.
- Harikrishnan S, Chandrasekharan K. Pulmonary hypertension in rheumatic heart disease. PVRI Review. 2009;1:13–9.
- Bonow RO, Carabello BA, Chatterjee K, de Leon AC Jr, Faxon D, Freed MD, et al. 2008 focused update incorporated into the ACC/AHA 2006 guidelines for the management of patients with valvular heart disease: a report of the American College of Cardiology/American Heart Association task force on practice guidelines (writing committee to revise the 1998 guidelines for the management of patients with valvular heart disease): endorsed by the Society of Cardiovascular Anesthesiologists, Society for Cardiovascular Angiography and Interventions, and Society of Thoracic Surgeons. Circulation. 2008;118(15):e523–661.
- Kern M, Deligonul U, Donohue T, Caracciolo E, Feldman T. Hemodynamic data. In: Kern MJ, editor. The cardiac catheterization handbook. 2nd ed. Missouri: Mosby; 1995. p. 108–207.
- Abbas AE, Fortuin FD, Schiller NB, Appleton CP, Moreno CA, Lester SJ. A simple method for noninvasive estimation of pulmonary vascular resistance. J Am Coll Cardiol. 2003;41(6):1021–7.
- Haddad F, Zamanian R, Beraud AS, Schnittger I, Feinstein J, Peterson T, et al. A novel non-invasive method of estimating pulmonary vascular resistance in patients with pulmonary arterial hypertension. J Am Soc Echocardiogr. 2009;22(5):523–9.
- Rajagopalan N, Simon MA, Suffoletto MS, Shah H, Edelman K, Mathier MA, et al. Noninvasive estimation of pulmonary vascular resistance in pulmonary hypertension. Echocardiography. 2009;26(5):489–94.
- Feigenbaum H. Mitral valve disease. In: Feigenbaum H, Amstrong W, Ryan T, editors. Echocardiography. 6th ed. Philadelphia: Lippincot Williams & Wilkins; 2005. p. 312–3.
- Oh J, Seward J, Tajik A. Valvular heart disease. In: Oh J, Seward J, Tajik A, editors. The echo manual. 3rd ed. Rochester: Lippincott Williams & Wilkins; 2007. p. 201–7.
- Lee KS, Abbas AE, Khandheria BK, Lester SJ. Echocardiographic assessment of right heart hemodynamic parameters. J Am Soc Echocardiogr. 2007;20(6):773–82.
- Baumgartner H, Hung J, Bermejo J, Chambers JB, Evangelista A, Griffin BP, et al. Echocardiographic assessment of valve stenosis: EAE/ASE recommendations for clinical practice. Eur J Echocardiogr. 2009;10(1):1–25.
- Anderson B. Doppler haemodynamic calculations. In: Anderson B, editor. Echocardiography. 1st ed. Brisbane: MGA Graphic; 2002. p. 123–46.
- Rudski LG, Lai WW, Afilalo J, Hua L, Handschumacher MD, Chandrasekaran K, et al. Guidelines for the echocardiographic assessment of the right heart in adults: a report from the American Society of Echocardiography endorsed by the European Association of Echocardiography, a registered branch of the European Society of Cardiology, and the Canadian Society of Echocardiography. J Am Soc Echocardiogr. 2010;23(7):685–713.
- Tei C, Dujardin K, Hodge DO, Bailey KR, McGoon MD, Tajik AJ, et al. Doppler echocardiographic index for assessment of global right ventricular function. J Am Soc Echocardiogr. 1996;9(6):838–47.
- Teske AJ, De Boeck BW, Melman PG, Sieswerda GT, Doevendans PA, Cramer MJM. Echocardiographic quantification of myocardial function using tissue deformation imaging, a guide to image acquisition and analysis using tissue doppler and speckle tracking. Cardiovasc Ultrasound. 2007;5(27):1–19.
- Bursac Z, Gauss CH, Williams DK, Hosmer DW. Purposeful selection of variables in logistic regression. Source Code Biol Med. 2008;3:17.
- Maldonado G, Greenland S. Simulation study of confounder-selection strategies. Am J Epidemiol. 1993;138(11):923–36.
- Steele PM, Fuster V, Cohen M, Ritter DG, McGoon DC. Isolated atrial septal defect with pulmonary vascular obstructive disease--long-term follow-up and prediction of outcome after surgical correction. Circulation. 1987;76(5):1037–42.
- Krishnamoorthy KM, Dash PK. Factors affecting immediate changes in cardiac output following balloon mitral valvulotomy: the role of pulmonary hemodynamics. J Heart Valve Dis. 2009;18(2):128–34.
- Anderson B. Doppler assessment of left ventricular systolic and diastolic function. In: Anderson B, editor. Echocardiography. 1st ed. Brisbane: MGA Graphic; 2002. p. 222–3.
- Vlahos AP, Feinstein JA, Schiller NB, Silverman NH. Extension of doppler -derived echocardiographic measures of pulmonary vascular resistance to patients with moderate or severe pulmonary vascular disease. J Am Soc Echocardiogr. 2008;21(6):711–4.
- Benza R, Tallaj J. Pulmonary hypertension out of proportion to left heart disease. Adv Pulm Hypertens. 2006;5:21–9.
- Haddad F, Doyle R, Murphy DJ, Hunt SA. Right ventricular function in cardiovascular disease, part II: pathophysiology, clinical importance, and management of right ventricular failure. Circulation. 2008;117:1717–31.
Copyright @ 2016 Authors. This is an open access article distributed under the terms of the Creative Commons Attribution-NonCommercial 4.0 International License (http://creativecommons.org/licenses/by-nc/4.0/), which permits unrestricted non-commercial use, distribution, and reproduction in any medium, provided the original author and source are properly cited.
mji.ui.ac.id