Section Abstract Introduction Methods Results Discussion Conflict of Interest Acknowledgment References
Clinical Research
Additional diagnostic value of digital radiology in plantar fasciitis diagnosis
pISSN: 0853-1773 • eISSN: 2252-8083
https://doi.org/10.13181/mji.v26i2.1514 Med J Indones. 2017;26:122–7
Received: August 03, 2016
Accepted: April 16, 2017
Author affiliation:
Department of Radiology, Faculty of Medicine, Universitas Indonesia, Cipto Mangunkusumo National Hospital, Jakarta, Indonesia
Corresponding author:
Marcel Prasetyo
E-mail: marcel.prasetyo@rscm.co.id
Background
Ultrasonography (USG) is regarded as the gold standard to differentiate normal plantar fascia and plantar fasciitis. Conventional radiography or plain X-ray is typically used to exclude differential diagnosis. Lately, conventional radiography has been digitalized and leads to better visualization of the soft tissue. However, it is not known whether digital radiography evaluation for calcaneus area, both qualitative and quantitative, has a similar diagnostic value as USG findings. Therefore, this study aimed to evaluate whether there is a strong correlation between digital radiographic and USG findings for diagnosing plantar fasciitis.
Methods
This is a cross sectional study examining adult patients (>18 years old) presenting with inferior heel pain. Plantar aponeurosis thickness was measured by digital radiography and ultrasonography; measurement was performed three times in each modality, and the average value was recorded. Fat stranding, presence of calcaneal enthesophyte, and microfracture were also evaluated in digital radiography. Measurement results were classified into plantar fasciitis diagnosis using the cut-off value 4 mm.
Results
There was no significant correlation between plantar aponeurosis thickness measured by digital radiography and by ultrasonography (r=0.069, p=0.688). There was no significant association between plantar fasciitis diagnosis by digital radiography and ultrasonography (p=0.162). However, digital radiography showed good sensitivity to detect plantar fasciitis using a cut-off value of >4 mm plantar fascia thickness.
Conclusion
Digital radiography might be used to aid definitive diagnosis for plantar fasciitis.
Keywords
calcaneus bone, digital radiography, plantar fasciitis, plantar aponeurosis, ultrasonography
Plantar fasciitis is a common cause of inferior heel pain due to edema or inflammation in the plantar aponeurosis. Although the etiology has not been clearly identified, several things has been identified as risk factors, such as increasing age, obesity, biomechanic abnormality of the feet, and heavy physical activity.1 Radiology plays an important role in diagnosing plantar fasciitis and in providing evaluation after treatment.2 Conventional radiography is typically used to exclude differential diagnosis. Radiographic findings in plantar fasciitis include osteophyte formation in calcaneus bone although it is not specific. Ultrasonography (USG) is an effective tool, regarded as the gold standard, for differentiating normal plantar fascia and plantar fasciitis. High-frequency USG is used to evaluate edema or thickening of plantar fascia; thickness of more than 4 mm is a diagnostic feature for plantar fasciitis.3,4
In the Department of Radiology of Cipto Mangunkusumo General Hospital, conventional radiography or plain X-ray has been digitalized to increase its image quality; it can visualize the soft tissue in a better quality.5 However, it is not known whether digital radiography evaluation for calcaneus area, both qualitative and quantitative, has a similar diagnostic value as USG findings. Therefore, this study aimed to evaluate whether digital radiographic correlates with ultrasonography (USG) findings in diagnosing plantar fasciitis.
METHODS
This is a cross-sectional study conducted at the Radiology Department of Cipto Mangunkusumo General Hospital from December 2014 to February 2015. This study has been approved by the Ethics Committee of the Faculty of Medicine, University of Indonesia (No. 80/UN2.F1/ETIK/2015). Subjects were recruited in consecutive sampling from plantar fasciitis patients who were referred to the Radiology Department of Cipto Mangunkusumo General Hospital. We included adult patients (>18 years old) presenting with inferior heel pain. Patients with open wound, mass, or infection in plantar surface of foot were excluded. Patients with history of surgery in plantar surface of foot, history of trauma, or fracture in the foot or ankle were also excluded.
Sample was plantar aponeurosis on the plantar side of the foot; since both feet were examined in this study, one patient could give 2 samples. Plantar fascia thickness was measured by two radiologists (MP, TS) for ultrasonography because the examination was very operator-dependent. The two operators were blinded; they did not know the digital radiography results and other operator’s ultrasonography result. Digital radiography data were interpreted by other radiologist (TP.S).
Patients underwent both digital radiography and USG examination on the same day; both feet were examined. Digital radiography used Siemens Multix Compact K/1175640X2187 machine, with exposure 40–50 kV and 4 mAs. Lateral projection was taken with subject lying on the lateral side of the examined foot, e.g. if the right foot was examined, the patient was asked to lie on his/her right side. The ankle was dorsiflexed, and digital radiography plate sized 18x24 cm was placed under the lateral malleolus. The fifth finger must be touching the radiography plate, and the ankle was on the centre of the plate. The other feet was placed in front of the plate and not be included in the film. The X-ray beam was centered on the calcaneus bone, which was about 2-3 cm below the medial malleolus. Lateral projection of both feet was taken to evaluate the calcaneus bone and the soft tissue surrounding it. A radiologist then evaluated the bone structure (normal/ subluxation/dislocation), bone density (normal/ porotic/sclerotic), osteophyte or enthesophyte formation particularly the enthesophyte in plantar side of calcaneus bone, fragmentation of osteophyte of enthesophyte, and edema or fat stranding in fat tissue surrounding the plantar fascia. In digital radiography, plantar fascia thickness was measured exactly on the inferior border of calcaneus bone where plantar aponeurosis inserted into calcaneus bone. Measurement was conducted three times, and then the average value was recorded.
USG was conducted using the Medison Accuvix V20 Prestige machine using linear transducer with 9–15 MHz frequency. Subject was lying in prone position, ankle dorsiflexed in 90 degrees. The operator examined from patient’s right-hand side, and the plantar aponeurosis was visualized in sagittal projection to evaluate the echogenicity (hypoechoic/ hyperechoic), linearity or plantar aponeurosis fibers (parallel/not parallel), enthesophyte formation, musculoaponeurosis, and rupture. Plantar aponeurosis thickness was measured in the anterior side of calcaneus bone’s inferior border, where plantar aponeurosis was inserted into calcaneus bone (Figure 1). Measurement was performed three times by each examiner, and the average value was recorded.
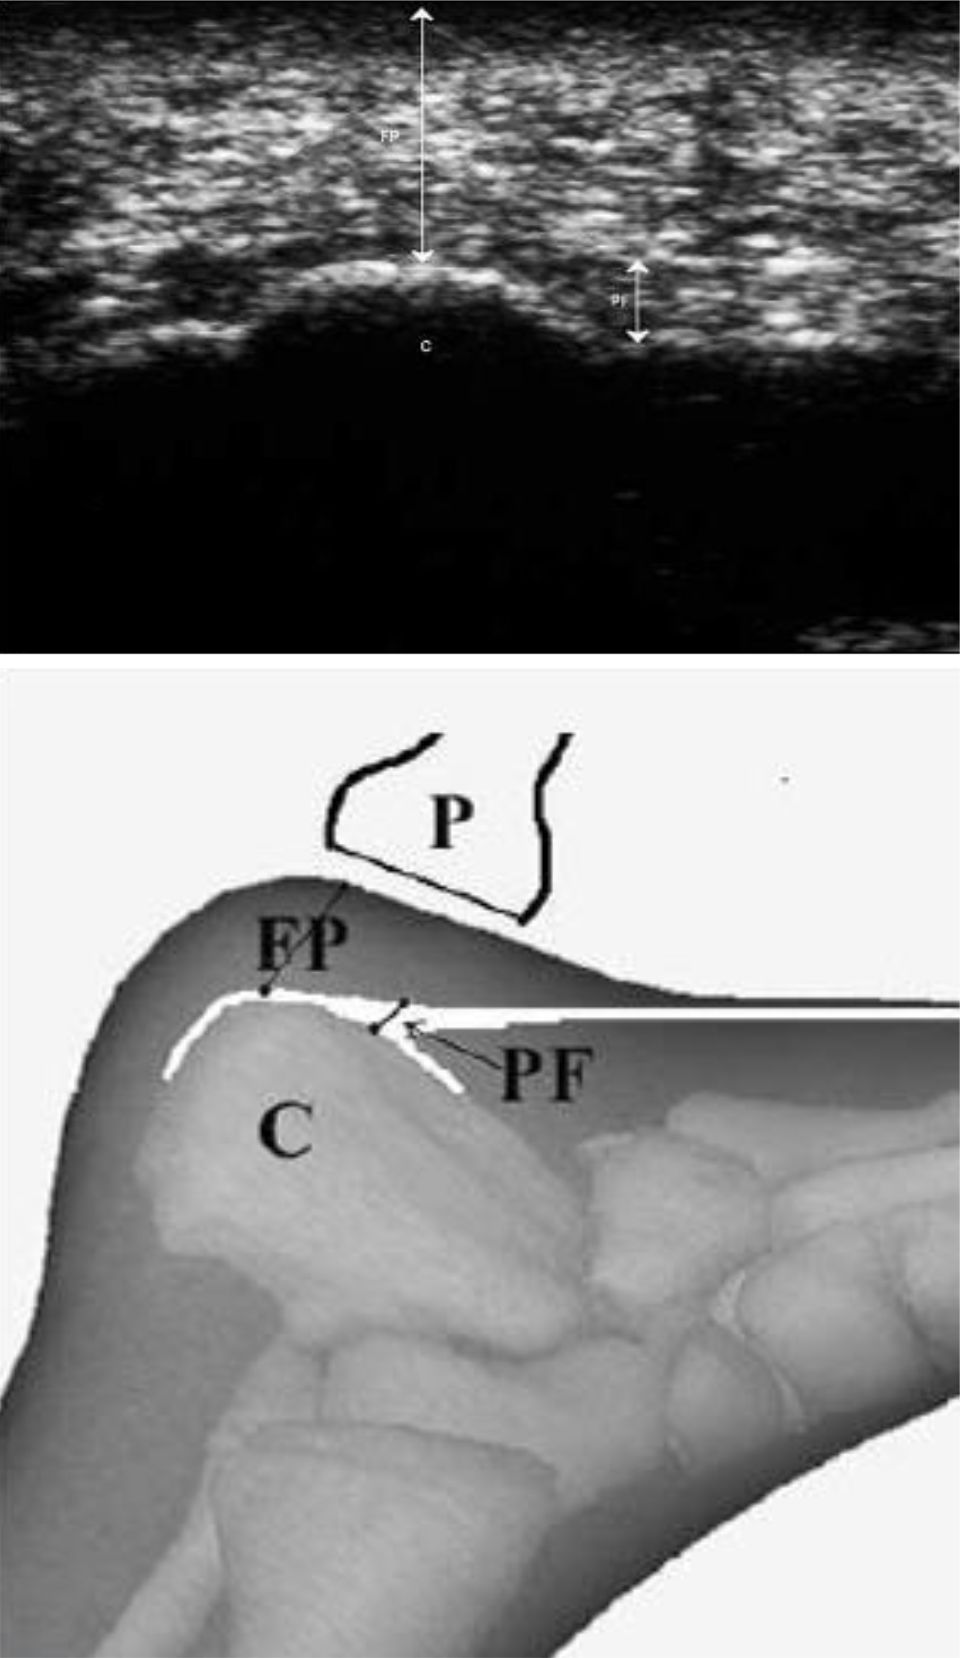
Figure 1. Plantar aponeurosis thickness measurement in USG, (a) longitudinal projection of calcaneus bone’s inferior border, showing normal plantar aponeurosis fibers (short arrow), (b) diagram showing transducer position for plantar aponeurosis thickness measurement. (C= calcaneus bone, FP= fat pad, P= probe/ ultrasound transducer, PF= plantar fascia)
Data were analyzed using SPSS version 20.0 to evaluate whether there was a correlation between plantar fascia thickness measured with digital radiography and USG as the gold standard. Sensitivity and specificity of digital radiography findings to diagnose plantar fasciitis were also tested.
RESULTS
Patients
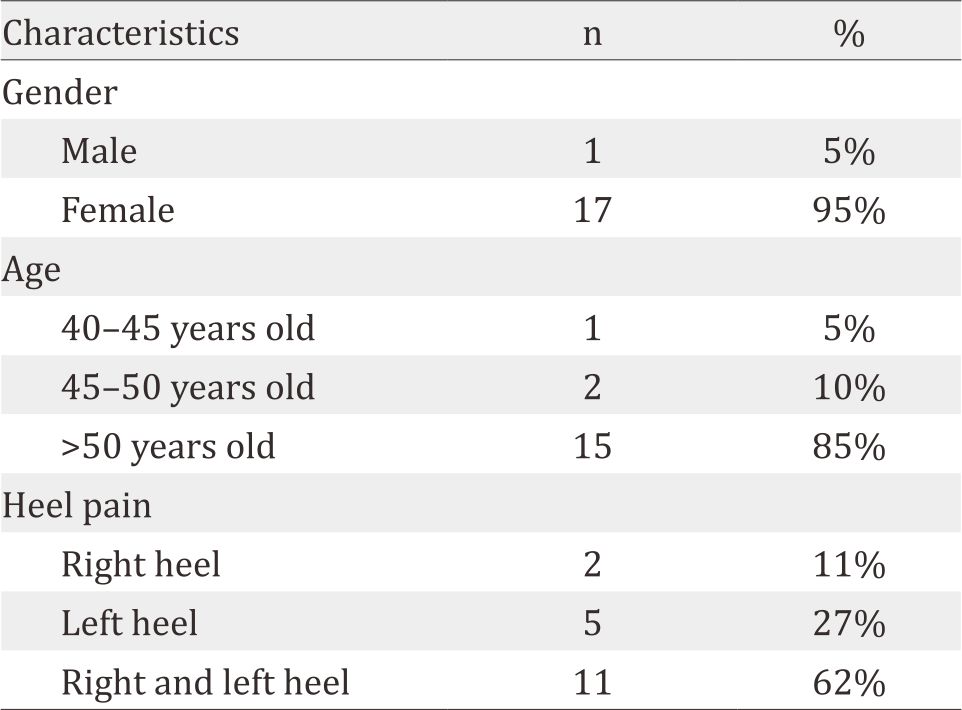
There were 18 subjects enrolled in this study. Basic charasteristic of subjects can be seen in table 1.
Table 1. Patients’ characteristics
Radiographic and ultrasonographic findings
Thirty six feet was examined, two from each patient. Mean plantar aponeurosis (PA) thickness in digital radiography was 6 mm, (3.5–9.8). PA >4 mm was found in 33 samples in digital radiography. Mean PA thickness in ultrasonography was 6 mm, (3.5–9.8). PA >4 mm was found in 34 samples in ultrasonography.
In digital radiography, fat stranding was found in 33 samples (91.6%), calcaneal enthesophyte in 32 samples (88.8%), and microfracture of calcaneal enthesophyte in 22 samples (61.1%) (Figure 2).
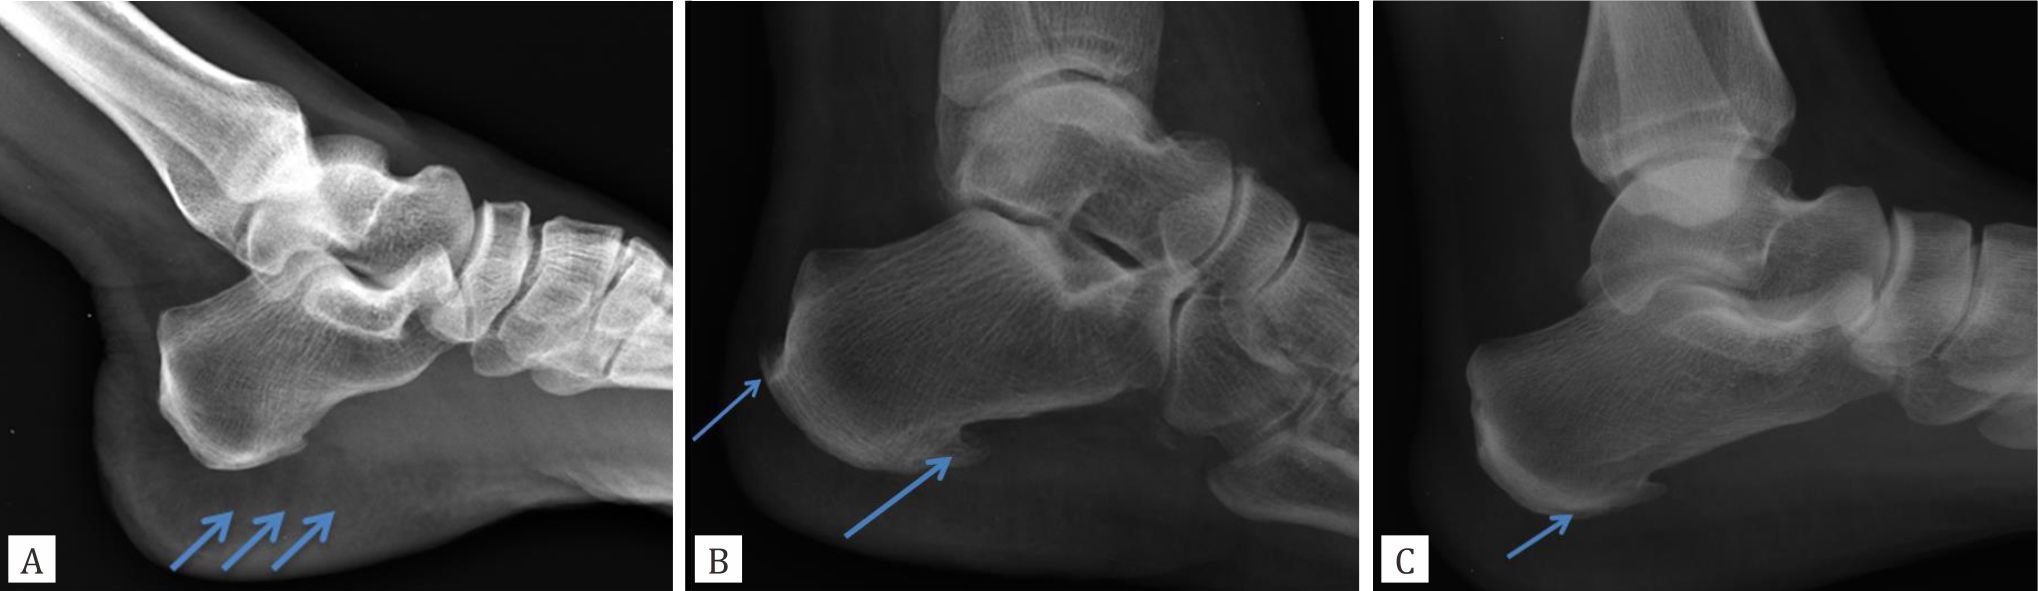
Figure 2. Digital radiography of patient with A) fat stranding (arrow); B) calcaneal enthesophyte; C) calcaneal microfracture
Correlation between digital radiographic and ultrasonographic measurement
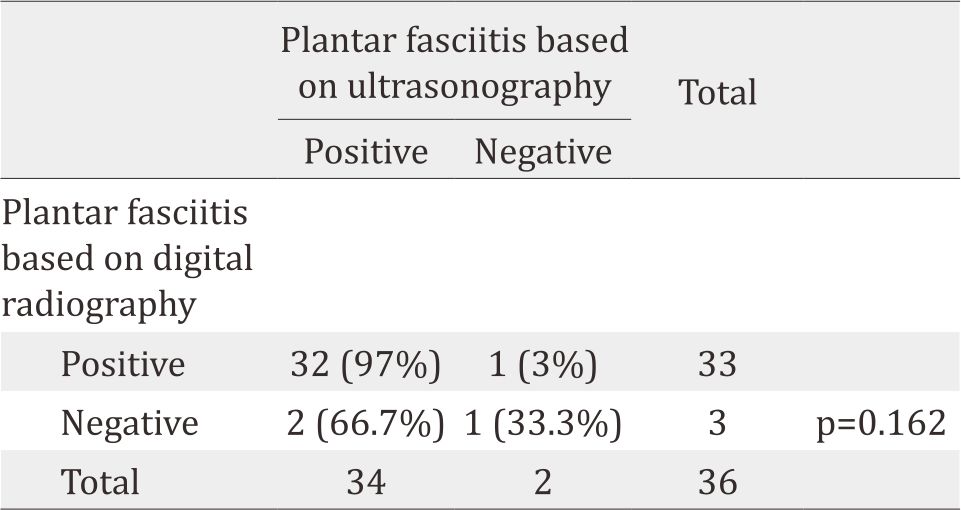
There was no significant correlation between measurement using digital radiography and using ultrasonography with Pearson correlation test (p=0.688) (Figure 3). The measurement results was then classified using the cut-off 4 mm thickness, positive if the thickness was more than 4 mm and negative if less than 4 mm. There was no significant association between plantar fasciitis diagnosis using digital radiography and using ultrasonography (p=0.162)(Table 2).
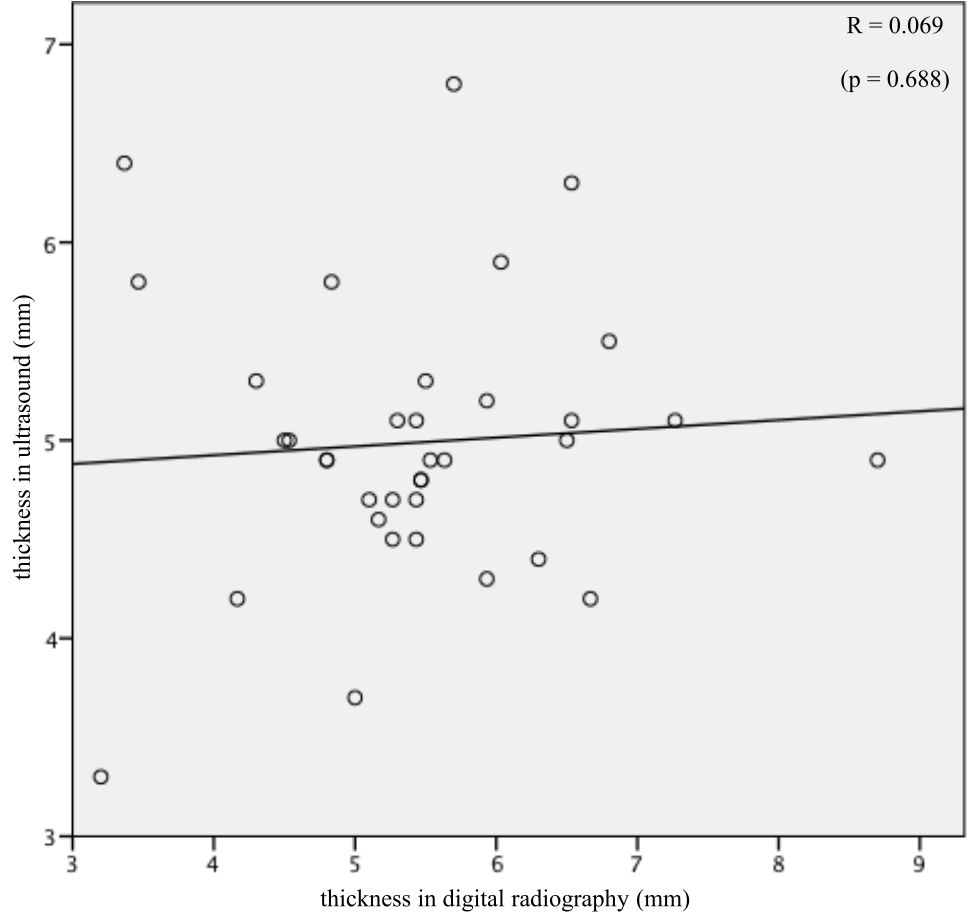
Figure 3. Scatter plot of plantar aponeurosis thickness measurement using digital radiography (X-axis) and using ultrasonography (Y-axis)
Table 2. Plantar fasciitis diagnosis using plantar fascia thickness (>4 mm) criteria by digital radiography measurement and ultrasonography measurement
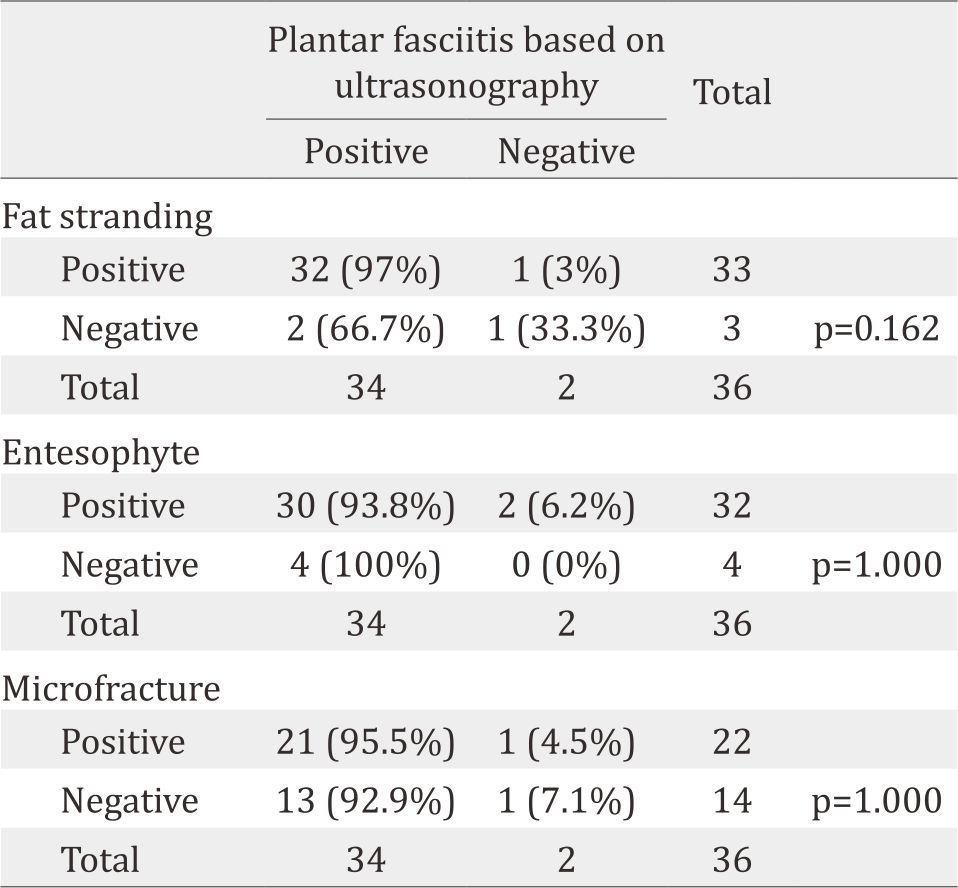
There was no significant association between fat stranding found in digital radiography and plantar fasciitis found in ultrasonography (p=0.162). Fat stranding was present in all plantar fasciitis cases diagnosed by digital radiography. There was no significant association between calcaneal enthesophyte, as well as microfracture, found in digital radiography and plantar fasciitis found in ultrasonography (p=1.000) (Table 3).
Table 3. Fat stranding, calcaneal entesophyte, and microfracture found in digital radiography and plantar fasciitis found in ultrasonography
DISCUSSION
Plantar fasciitis is an inflammation process, which can be diagnosed accurately using ultrasonography, with plantar fascia thickness cut-off value 4 mm. Other ultrasonography findings can also support the diagnosis, such as hypoechoic plantar aponeurosis, fluid collection in the surrounding fat tissue, and pain elicited by compression maneuver. Lateral projection radiography of calcaneus bone is also widely used in plantar fasciitis, but its utilization is focused on calcaneal enthesophyte or spur detection and excluding differential diagnoses. Levy et al6 proved that radiography was not beneficial in diagnosing plantar fasciitis. Osborne et al7 showed that plantar fascia thickness and fat pad abnormality found in calcaneus bone radiography (lateral projection) had 85% sensitivity and 95% specificity to diagnose plantar fasciitis.
Digital radiography of calcaneus bone using lateral projection could visualize plantar aponeurosis clearly, and its thickness could be measured. In this study, plantar aponeurosis measurement has been done three times, and the mean value was used for data analysis. However, this study did not find significant correlation between plantar aponeurosis measurement using digital radiography and using ultrasonography. Acutely inflamed plantar aponeurosis is often accompanied with surrounding fat tissue edema, which was also looked radioopaque, known as “fat stranding”. The presence of fat stranding actually made plantar aponeurosis measurement more difficult; this was probably due to the inconsistency in radiographic measurement. Therefore, measurement of plantar aponeurosis thickness by digital radiography was inferior to ultrasonography.
When the plantar aponeurosis thickness was classified into less than 4 mm and more than 4 mm, digital radiography findings had no significant association with ultrasonography (p=0.162). However, statistical analysis showed good sensitivity and positive predictive value, both >80%, for plantar fasciitis diagnosis by digital radiography. The surrounding fat tissue edema (fat-stranding) could make plantar fascia thicker than it actually was when measured by digital radiography. As a result, normal plantar fascia thickness (<4 mm) appeared abnormal, and false positive could happen more frequently (lower specificity) in digital radiography. Conversely, a true abnormal plantar thickness (>4 mm) would be more highlighted by the surrounding edema, and therefore, false negative could rarely happen (higher sensitivity). In this study, all patients who actually had plantar fasciitis (diagnosed by ultrasonography) also had fat-stranding in digital radiography. This finding was consistent with the pathophysiology of plantar fasciitis, in which acutely inflamed plantar fascia was often accompanied by edema of the surrounding fat tissue. Thus, the presence of fat-stranding had good sensitivity in detecting an actual plantar fasciitis, as showed by Osborne et al7 This initial result and previous studies showed potential utilization for digital radiography to provide definitive diagnosis of plantar fasciitis. However, further study with larger sample size would be needed before we could recommend the use of digital radiography alone, without ultrasonography, to diagnose plantar fasciitis.
The presence of calcaneal enthesophyte or microfracture in digital radiography and plantar fasciitis diagnosis in ultrasonography both showed insignificant association. There was a wide difference in significance value between association of enthesophyte in radiography – plantar fasciitis in ultrasonography, and fat stranding in radiography – plantar fasciitis in ultrasonography, suggesting that the presence of calcaneal enthesophyte or microfracture in digital radiography was truly not associated with plantar fasciitis, and conducting further study with larger sample size would not bring any difference in its statistical significance. This finding was also supported by Abreu et al8 which showed only 3% of calcaneal enthesophyte was located inside the plantar aponeurosis, while more than 90% was found outside plantar aponeurosis region. Therefore, plantar fasciitis was most likely not influenced by calcaneal enthesophyte.
Digital radiography could be potentially used to provide definitive diagnosis of plantar fasciitis, using plantar aponeurosis thickness cut-off value of 4 mm. However, this study had limitation: the small sample size. If further studies with larger sample size could confirm it, the plantar fasciitis diagnosis could be more efficient and cost-effective. By using digital radiography alone, examination time could be much shortened. It would also be more comfortable for patients because in ultrasonography examination, patients had to be lying in prone position, which was uncomfortable especially for obese patients. Additionally, digital radiography could also evaluate bony structure of the heel, which could not be evaluated in ultrasonography. Therefore, not only digital radiography could diagnose plantar fasciitis, but it could also evaluate or exclude other causes of heel pain, such as microfracture and heel spur.
In conclusion, digital radiography might be used to provide definitive diagnosis in plantar fasciitis cases, using plantar fascia thickness cut-off value 4 mm.
Conflicts of Interest
The authors affirm no conflicts of interest in this study.
Acknowledgment
The authors acknowledge dr. Benedicta Mutiara Suwita for her contribution in editing the manuscript. This study received fundings from National General Hospital Cipto Mangunkusumo operational research grant.
REFERENCES
- Nuran S, Semra D, Baki Y, Nevzat K, Sibel C. Clinical Utility of Sonography in Diagnosing Plantar Fasciitis. J Ultrasound Med. 2005; 24(8):1041–8.
- Potter VAJ. Investigating Plantar Fasciitis. The Foot and Ankle Online Journal. 2009;2(11):4.
- Ahn JM, El-Khoury GY. Radiologic Evaluation of Chronic Foot Pain. Am Fam Physician. 2007;76(7):975–983.
- Wearing SC, Smeathers JE, Sullivan PM, Yates B, Urry SR, Dubois P. Plantar Fasciitis: Are Pain and Fascial Thickness Associated With Arch Shape and Loading?. Phys Ther. 2007;87(8):1002–8.
- www.idexx.com [Internet]. Computed Radiography in Perspective. [updated 2014 July 11; cited 2016 Feb 09]. Available from: https://www.idexx.com/.
- Levy JC, Mizel MS, Clifford PD, Temple HT. Value of Radiographs in the Initial Evaluation of Nontraumatic Adult Heel Pain. Foot Ankle Int. 2006;27(6):427–30.
- Osborne HR, Breidhl WH, Allison GT. Critical differences in lateral X-rays with and without a diagnosis of plantar fasciitis. J Sci Med Sport. 2006;9(3):231–7.
- Abreu MR, Chung CB, Mendes L, Mohana BA, Trudell D, Resnick D. Plantar calcaneal enthesophytes: new observation regarding sites of origin based on radiographic, MR imaging, anatomic, and paleopathologic analysis. Skeletal Radiol. 2003;32(1):13–21.
Copyright @ 2017 Authors. This is an open access article distributed under the terms of the Creative Commons Attribution-NonCommercial 4.0 International License (http://creativecommons.org/licenses/by-nc/4.0/), which permits unrestricted non-commercial use, distribution, and reproduction in any medium, provided the original author and source are properly cited.
mji.ui.ac.id