Section Abstract Introduction Methods Results Discussion Conflict of Interest Acknowledgment References
Clinical Research
The effect of balanced electrolyte solution versus normal saline in the prevention of hyperchloremic metabolic acidosis in diabetic ketoacidosis patients: a randomized controlled trial
pISSN: 0853-1773 • eISSN: 2252-8083
https://doi.org/10.13181/mji.v26i2.1542 Med J Indones. 2017;26:134–40
Received: August 25, 2016
Accepted: February 06, 2017
Author affiliation:
Department of Anesthesiology and Intensive Therapy, Faculty of Medicine, Cipto Mangunkusumo Hospital, Universitas Indonesia, Jakarta, Indonesia
Corresponding author:
Dita Aditianingsih
E-mail: -ditaaditiaa@gmail.com
Background
In resuscitation, normal saline could cause hyperchloremic metabolic acidosis, while balanced electrolyte solution is a crystalloid fluid resembling blood plasma with lower chloride content. This study compared the effect of normal saline and balanced electrolyte solution Ringerfundin (BES) as the resuscitation fluid in diabetic ketoacidosis (DKA) patients. Parameters applied in this study were standard base excess (SBE) as resuscitation’s result indicator and strong ion difference (SID) to measure chloride’s influence in developing hyperchloremic acidosis.
Methods
A prospective, randomized, single blind controlled trial was conducted at the Emergency Department of Cipto Mangunkusumo Hospital. Thirty subjects with blood sugar >250 mg/dl, arterial pH <7.35 mg/dl, and positive blood ketone were randomly allocated to receive either normal saline (NS) or RingerfundinÒ (BES) as the standardized resuscitation protocol. Data analysis was performed using the unpaired T-test and the Mann Whitney test to compare the SBE and the SID means between both groups. Additional parameters were the level of consciousness, blood sugar level, vital signs, blood gas analysis, lactate, electrolyte, and blood ketone.
Results
The mean SID in the BES group was significantly greater than the NS group of all measurements (p<0.05). The BES group had significantly higher mean SBE compared to the NS group at 18 hours (-4.88±5.69 vs -9.68±5.64; p=0.009), 24 hours (-3.99±4.27 vs -8.7±5.35; p=0.023), and 48 hours (-4.06±4.11 vs -7.01±5.46; p=0.009). BES resulted in nonsignificant higher delta SBE and SID than NS. Additional parameters were not different between both groups.
Conclusion
This study showed that fluid resuscitation of DKA patients with BES resulted in slightly but not significantly higher mean actual SBE and SID than NS. suggesting that BES as an alternative fluid resuscitation to prevent hyperchloremic acidosis in diabetic ketoacidosis patients was not superior to NS.
Keywords
balanced electrolyte solution, diabetic ketoacidosis, hyperchloremic acidosis, normal saline, standard base excess, strong ion difference
Diabetic ketoacidosis (DKA) remains as one of the major complications of diabetes mellitus. This condition is associated with significant metabolic changes and a high mortality rate. Diabetic ketoacidosis is defined as an accumulation of ketone bodies in the circulation of patients due to uncontrolled diabetes mellitus with insulin resistance. It was accompanied by severe fluid depletion and electrolyte imbalance, which are associated with metabolic acidosis. Common etiologies of diabetic ketoacidosis include infection, discontinued insulin therapy, and new onset diabetes.1,2 Diabetic ketoacidosis is a lifethreatening condition as the mortality rate of DKA is relatively high, which is between 15–51%. The major causes of death include unresolved severe metabolic acidosis, septic shock, and circulatory failure.2
The practice of large volume of fluid administration is found during perioperative condition and fluid resuscitation in DKA. Scheingraber et al3 conducted a research on two groups consisted of 12 subjects undergoing gynecology surgical procedure. The control group received normal saline perioperatively, while the other group received ringer lactate fluid. Both received similar volume of fluid, which was 30 mL/kg/ hour. This study showed that the hyperchloremic metabolic acidosis and higher post-operative complications were observed in the normal saline group.3 Based on the American Diabetes Association (ADA), the highest priority of diabetic ketoacidosis management is the replacement of the fluid deficit with isotonic crystalloid solution, such as normal saline. Normal saline is widely used as it contains high chloride concentration, pH of 5.5 incomparable with physiological pH. Moreover, as fluid resuscitation, it is associated with hyperchloremia.1,2 Hyperchloremic acidosis is a form of metabolic acidosis, associated with an increase in plasma chloride concentration. This may occur in aggressive resuscitation with high chloride concentration fluid, or due to impair chloride excretion in the kidneys. Hyperchloremia will worsen the condition of metabolic acidosis, increase inflammatory cytokines, and impair renal function. The balanced electrolyte solution (BES) is known to have electrolyte contents similar to physiological condition, and is suggested to be used during management of diabetic ketoacidosis patients. Mahler et al4 mentioned that patients with diabetic ketoacidosis receiving normal saline solution had higher chloride concentration in comparison with patients receiving BES. Van Zyl et al5 presented the normalization of pH was non-significantly faster in DKA patients resuscitated with ringer’s lactate instead of normal saline. The pH or chloride level is poor reflections of resolution of DKA. The severity of metabolic acidosis was calculated by the standard base excess (SBE), and the improvement of SBE was associated with better outcome in critically ill patients.6 The strong ion difference (SID) was calculated to show the influence of chloride level on hyperchloremic metabolic acidosis. The aim of this present study was to compare balanced electrolyte solution (BES) Ringerfundin® to normal saline in inducing of hyperchloremic metabolic acidosis in DKA, based on mean SID and SBE as primary endpoints.
METHODS
This was a single blind randomized controlled trial conducted at the Emergency Department of Cipto Mangunkusumo Hospital, Jakarta, Indonesia, on May to October 2013. The protocol of this study has been approved by Medical Ethics Committee of Universitas Indonesia (No. 315/ H2.F1/ETIK/2013). The management of diabetic ketoacidosis in this study was in accordance with the guideline from the Division of Endocrinology, Department of Internal Medicine, Faculty of Medicine, Universitas Indonesia, Cipto Mangunkusumo Hospital, Jakarta.
Inclusion criteria were patients with diabetic ketoacidosis aged 18–65 years old, agreed to participate in the study, had blood sugar level during hospital admission >250 mg/dL, had positive ketone bodies in the blood, and had arterial blood pH less than 7.35. Exclusion criteria were subjects with respiratory failure requiring mechanical ventilation, end-stage renal disease on hemodialysis, congestive heart failure, corrected sodium >158 or <120 mg/ dL, myocardial infarction with signs of heart failure, traumatic brain injury with cerebral edema signs, and liver failure. The CONSORT flow diagram of this study is shown in Figure 1.
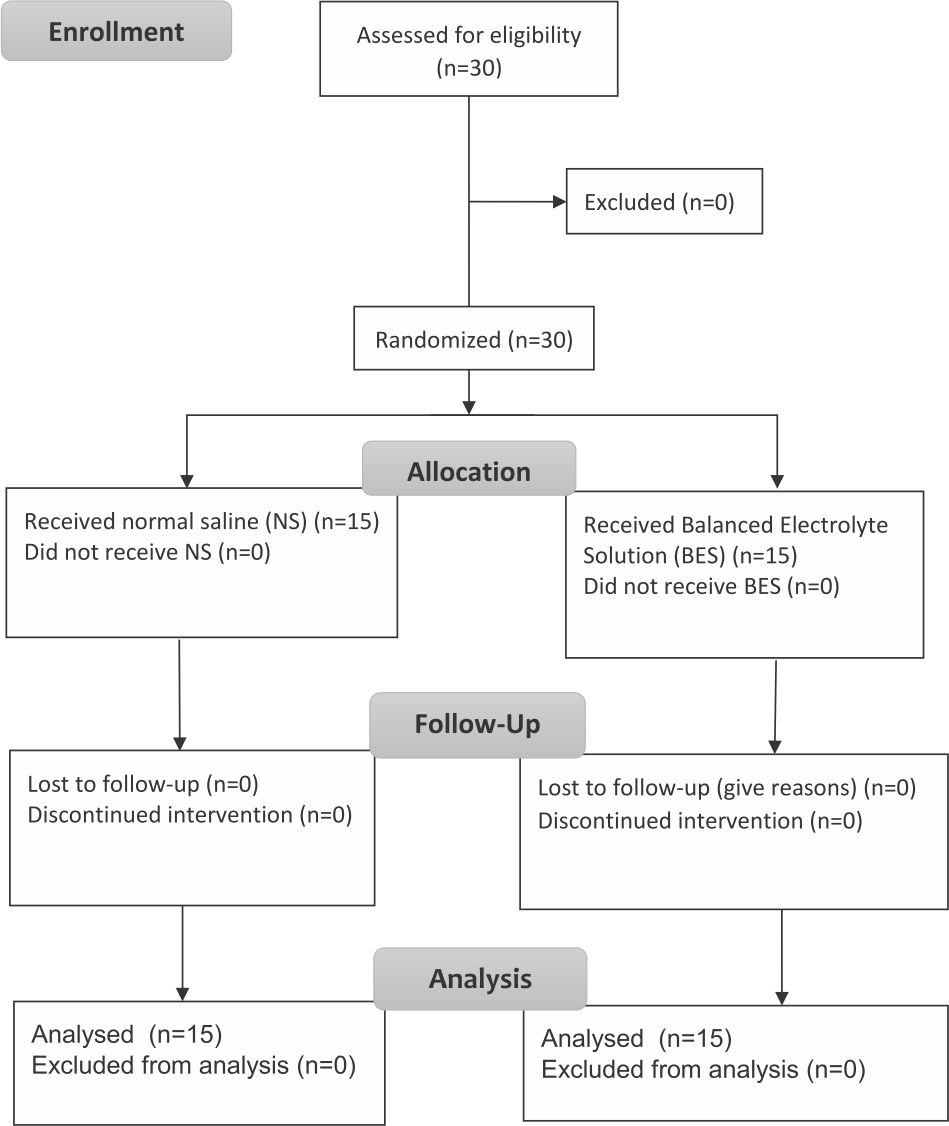
Figure 1. CONSORT flow diagram
Subjects following inclusion and exclusion criteria were randomly allocated to the groups. The intervention given from the pharmacy for each subject was concealed. Subjects received peripheral and central intravenous access, nasogastric tube, and urinary catheter. Vital signs, blood pressure, heart rate, respiratory rate, level of consciousness, central venous pressure (CVP), diuresis, and hydration status were monitored hourly. Random blood glucose level was monitored hourly for the first six hours, then 12 hours, 24 hours, 36 hours, and 48 hours. Arterial blood gas analysis, lactate, and electrolyte were measured every two hours for the first six hours, then 12 hours, 24 hours, 36 hours, and 48 hours. Blood ketone was evaluated every six hours for the first 48 hours. Blood urea nitrogen (BUN) and creatinine level were measured every 24 hours for the first 48 hours. Corrected sodium was measured by formula:6
Corrected sodium = measured sodium + (random blood glucose - 100) x 0.016
Subjects received adequate antibiotics if there were signs of infection, oxygen supplementation if pO2<80 mmHg, and heparin if there was disseminated intravascular coagulation (DIC) or severe hyperosmolarity (>380 mOsm/L). Management of the patients included fluid resuscitation, insulin, potassium, and bicarbonate correction, as showed in Figure 2. Subjects were followed up until 28 days to measure the renal functions.
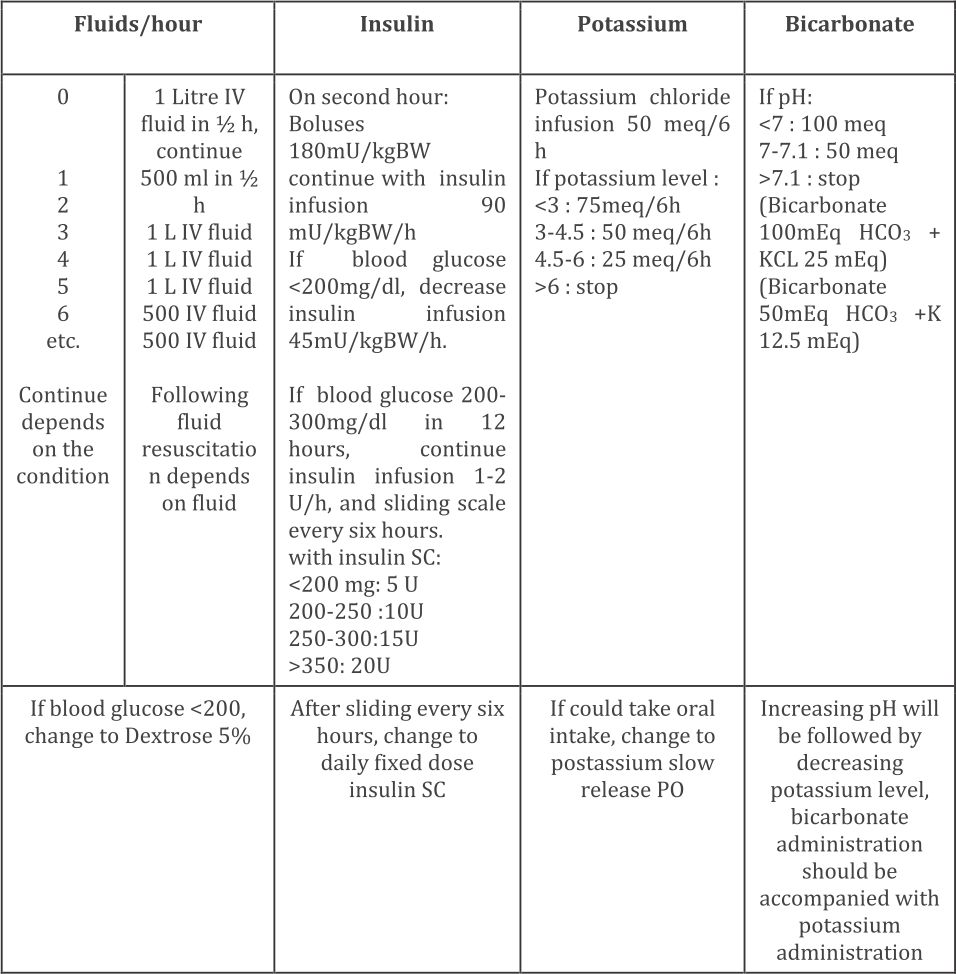
Figure 2. Management protocol of diabetic ketoacidosis at Cipto Mangunkusumo Hospital (Adapted from American Diabetes Association. Diabetes Care. 2006;29;2743)1 IV=intravenous; SC=subcutaneus; PO=per orally
Data collected in this study were baseline characteristics, consciousness level, mean arterial pressure (MAP), CVP, blood glucose level, arterial pH, ketone bodies, BUN, creatinine, mortality rate, and SBE. Corrected sodium, potassium, chloride, calcium, magnesium, were measured to be calculated as the SID by formula:
SID = [Na+] (mEq/L) + [K+] (mEq/L) +[Ca++] (mEq/L) + [Mg++] (mEq/L) - [Cl-] (mEq/L)
SBE and SID between the two groups were compared, while other parameters were reported descriptively.
An intention-to-treat analysis was performed on subjects receiving at least six hours of fluid study. Data was analyzed using the Statistical Program for Social Sciences (SPSS) version 16.0. The data normality was tested using the Saphiro-Wilk test. The unpaired t-test was used for normal distribution data and the Mann Whitney test was used for non-normal distribution data.
RESULTS
Subjects’ characteristics along with several measured parameters are shown in Table 1. There were significant differences of mean SBE (Figure 3) and mean SID (Figure 4) between both groups were observed. The BES group had significantly higher SBE compared to the NS group at 24 hours (-3.99±4.27 vs -8.7±5.35; p=0.023), and at 48 hours (-4.06±4.11 vs -7.01±5.46; p=0.009), while mean SID in the BES group was significantly greater than the NS group at all measurements (p<0.05).
Table 1. Subjects’ characteristics of both groups during interventions
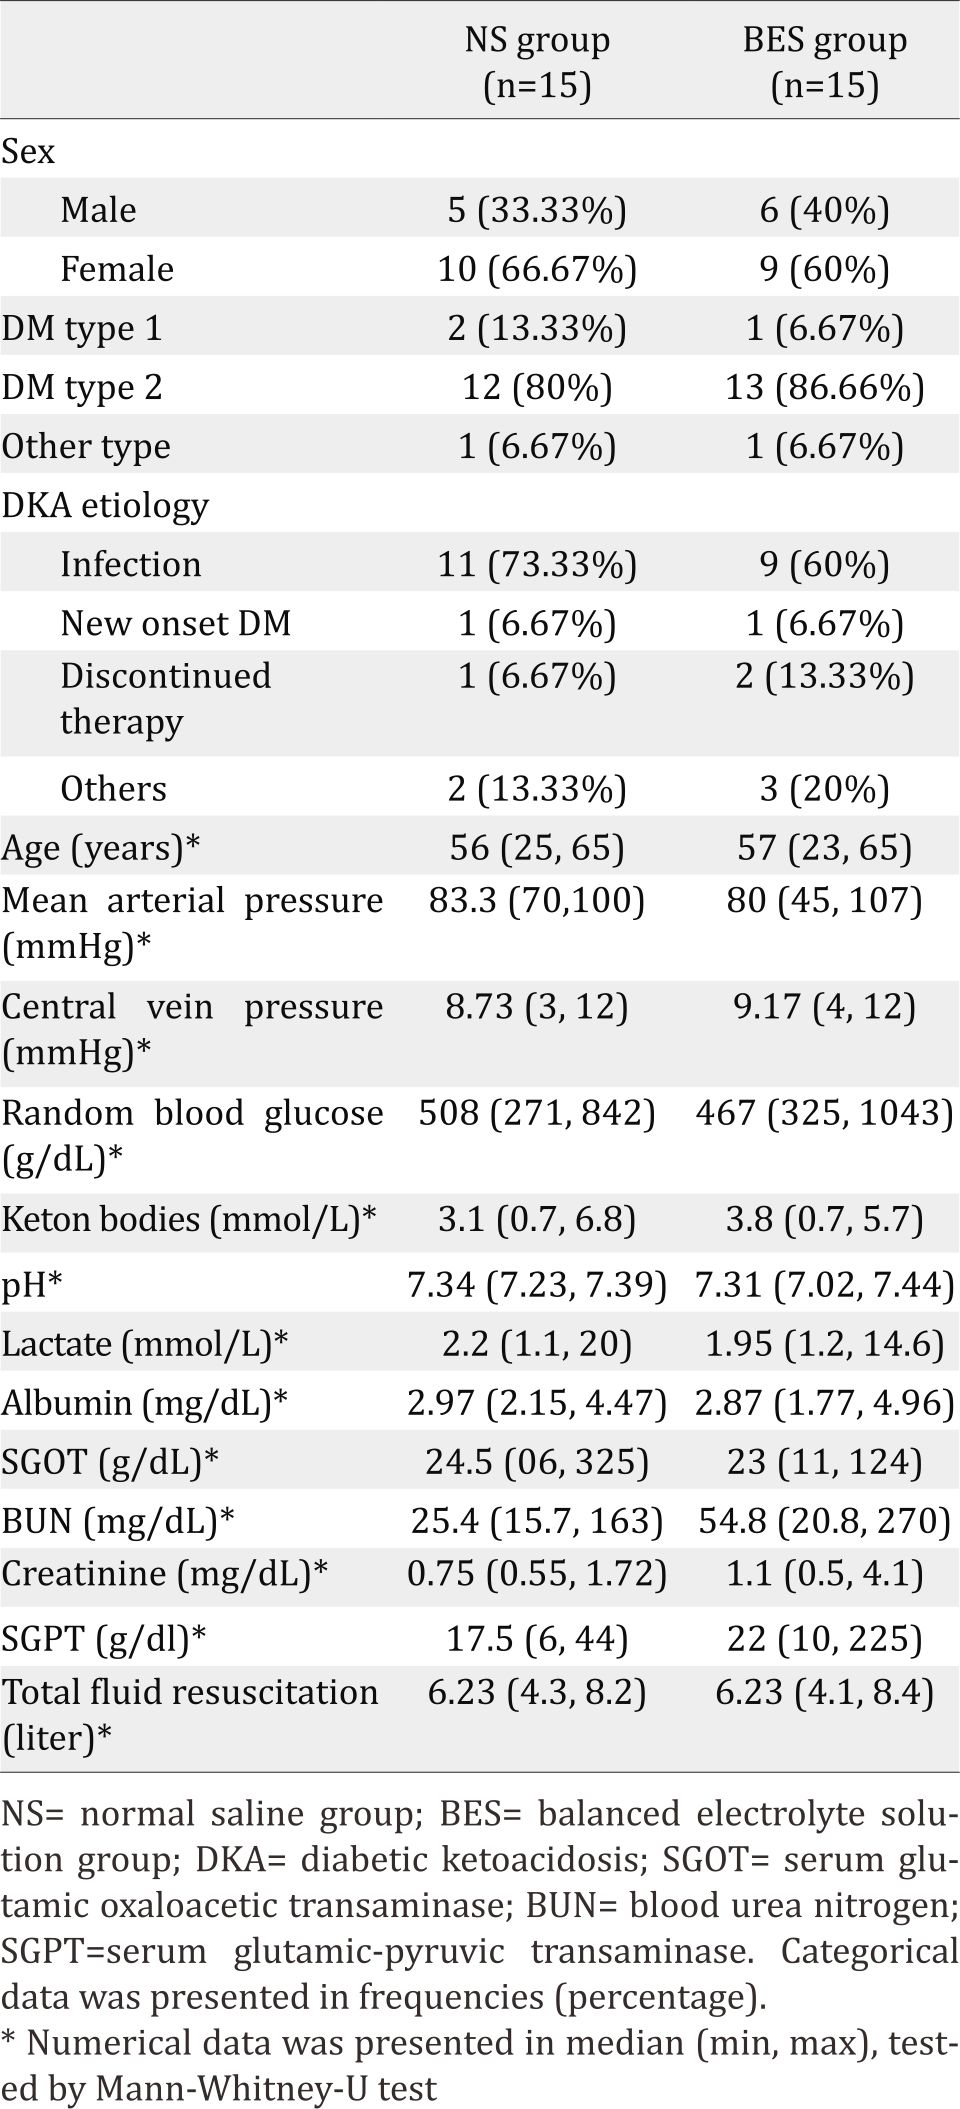
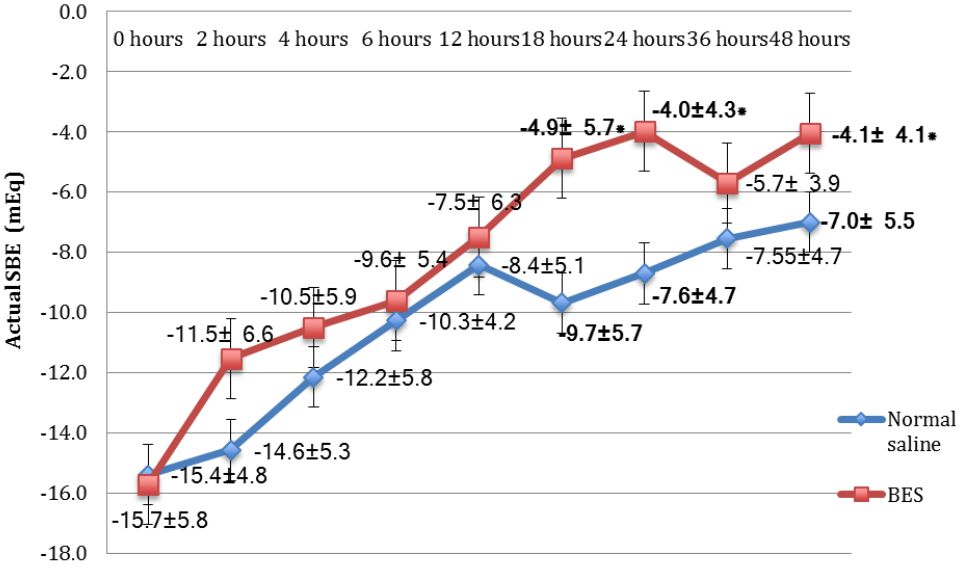
Figure 3. Mean actual values of SBE of the NS group and the BES group. Data was presented in mean±SD, tested by unpaired t-test, *p<0.05 was significant. SBE= standard base excess; NS= normal saline group; BES= balanced electrolyte solution group; SD= standard deviation
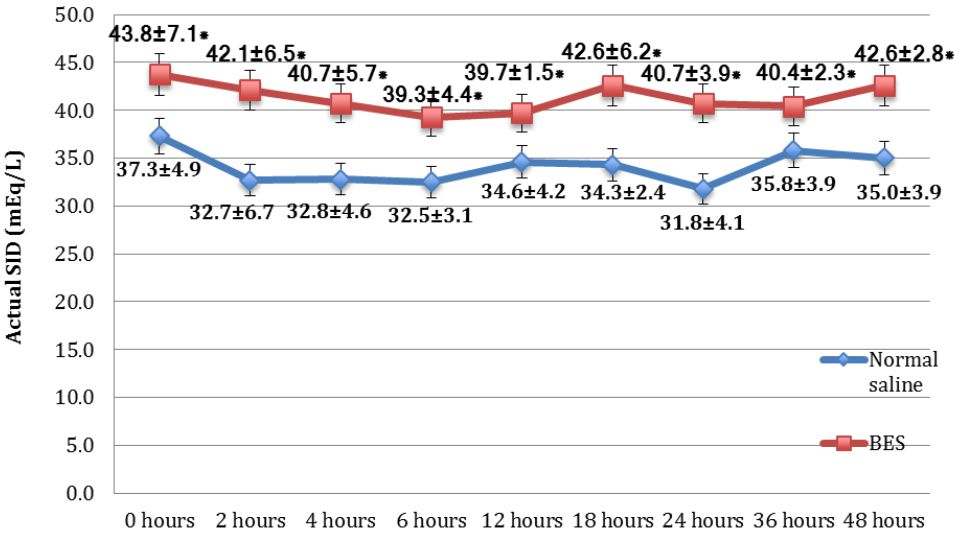
Figure 4. Mean actual values of SID of the NS group and the BES group. Data was presented in mean±SD, tested by unpaired t-test, *p<0.05 was significant. SBE=standard base excess; NS=normal saline group; BES=balanced electrolyte solution group; SD=standard deviation
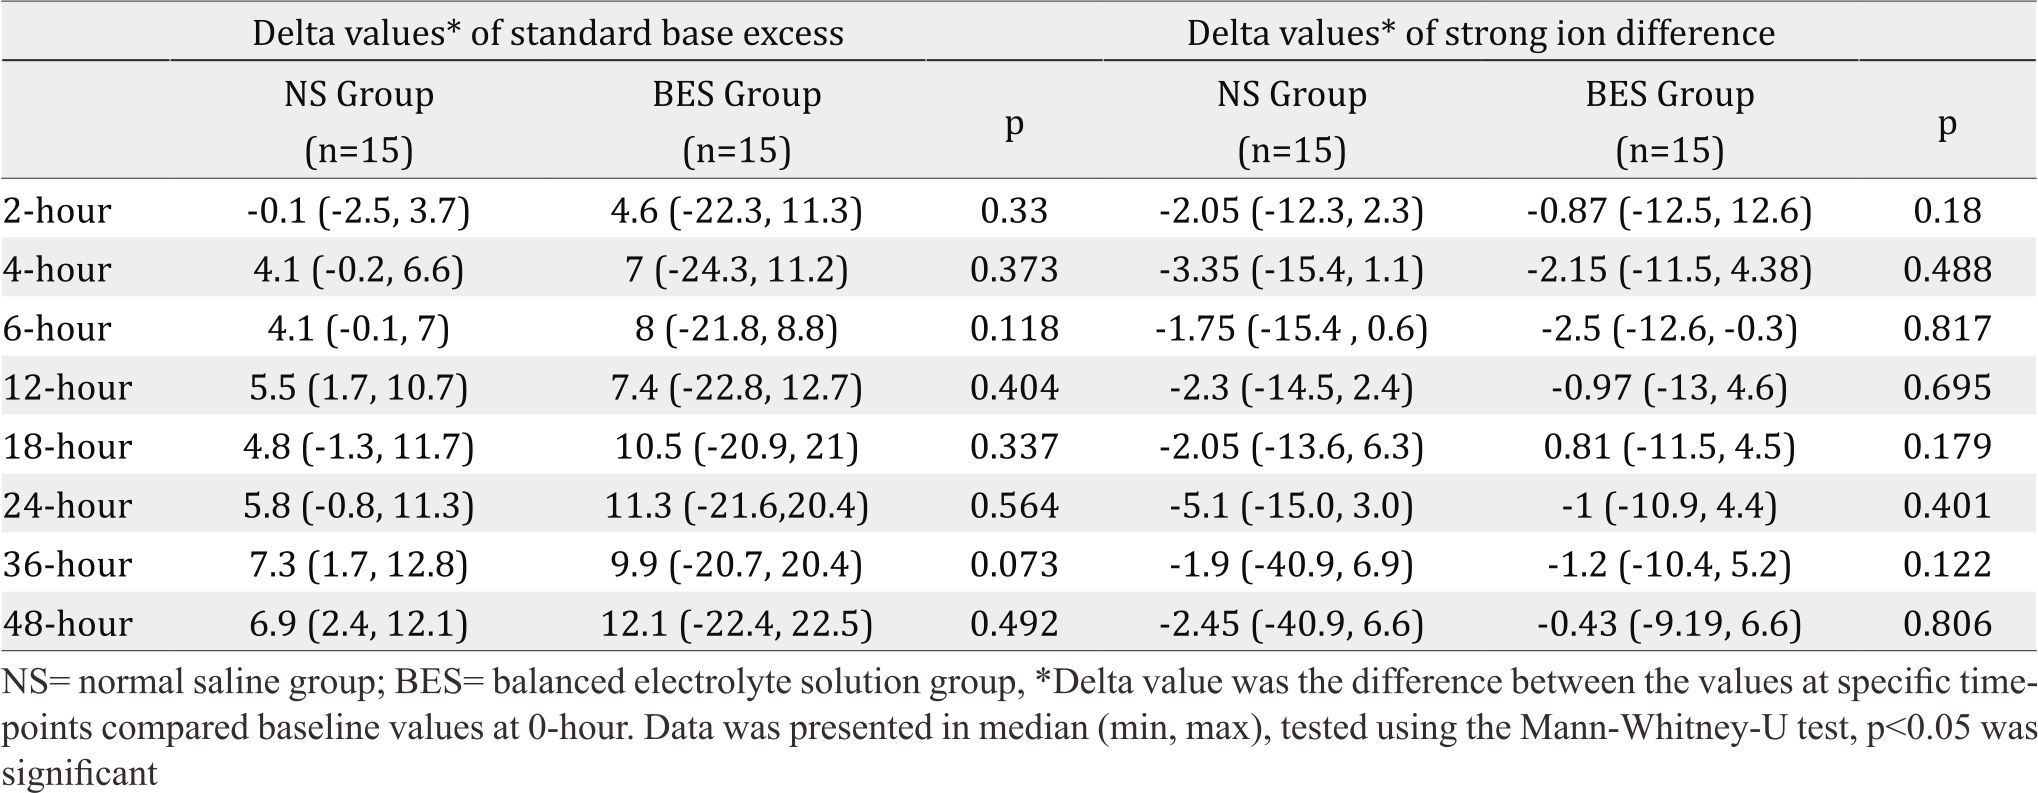
Since the baseline of SID was significantly higher in the BES group, the mean increase (delta) between the actual values SID and SBE at the every timepoints measurement to baseline values at hour 0 was calculated. The delta value of SID and SBE (Table 2) were not significantly higher in the BES group at all measurements.
Table 2. Delta values of standard base excess and strong ion difference
Of 30 subjects, 25 subjects survived up to 28 days after admission, four subjects (two subjects in each group) died within 28 days, and one subject died within 48 hours. Furthermore, one subject suffered from cardiopulmonary arrest and had a return of spontaneous circulation within the first 48 hours. There was no difference of mortality between groups, and the benefit of BES over mortality was not analyzed because of the study design and small number of samples.
DISCUSSION
Stewart et al7 mentioned that two variables influencing acid-base balance can be grouped into independent and dependent variables. The independent variables were carbon dioxide pressure (pCO2), SID, and non-volatile weak acid (albumin effect). The dependent variables were [H+], [OH-], [HA], [A-], [HCO3-], and [CO32-] ions. Therefore, pH, as the negative logarithm of hydrogen ion [H+], was a function of three variables, which were pCO2, SID, albumin effect. SID or sodium-chloride effect was described as the difference between total strong cation (sodium, potassium, magnesium, calcium) and total strong anion (chloride). Potassium, magnesium, and calcium were usually neglected due to its small value.7 The cause of acid-base disturbance could be measured quantitatively by using the Stewart- Fencl formula. This formula utilized SBE, SID effect, albumin effect, and unmeasured anion effect. The first step was to identify the SBE based on blood gas analysis, followed by determining the sodiumchloride or SID effect. Albumin acts as a weak acid; therefore, the level of albumin effect might cause acid-base imbalance. The unmeasured anion (UA) effect is the concentration of lactate, ketone, phosphate and other unidentified ions. It can be derived as the difference of SBE with SID and the albumin effect.6
Metabolic acidosis was characterized by the decreasing pH and bicarbonate level, which was caused by decreased SID or increased weak acids concentration. Mean SID in the BES group had more superior values significantly than in the NS group at every hour. Mean hourly SBE in the BES group were mostly higher than in the NS group, and the significant difference occurred at 18, 24, and 48 hours (illustrated in Figure 3 and Figure 4).
In terms of fluid management for diabetic ketoacidosis, the effect of large fluid resuscitation administered for the patients would influence the SID calculation. Normal saline administered for the patients had SID=0 because of the same numbers of strong positive and negative ions. The result of fluid resuscitation with SID=0 was that the physiological ions would suffer from volume dilution as well as the addition of sodium and chloride ions at the same time. For example, in the plasma, there was 140 mEq/L sodium ions, 100 mEg/L chloride ions; therefore, the SID plasma = 140 mEq/L – 100 mEq/L = 40 mEq/L. If 1 L of normal saline given to the patient with 3 L blood volume, then there would be a dilution with (140x3 mEq/L+154 mEq/L)/(3+1) = 143 mEq/L sodium ions, and (100x3 mEq/L + 154 mEq/L)/(3+1) = 113.5 mEq/L. Therefore, the present SID was 143 mEq/L – 113.5mEq/L = 29.5 mEq/L, while the normal SID was 38-44 mEq/L.8,9 Decreased SID causes the plasma to be acidotic; defined as a dilutional metabolic acidosis due to normal saline or hyperchloremic metabolic acidosis. Even though SBE showed a significant difference only at 18 hours, 24 hours, and 48 hours, the mean SBE among the BES group was always higher than the NS group.
Two types of metabolic acidosis are mineral (anorganic) and organic metabolic acidosis. Anorganic metabolic acidosis was caused by increased anions which could not be metabolized (e.g. hyperchloremic acidosis); while organic metabolic acidosis was caused by metabolism disorder (e.g. lactic acidosis, diabetic ketoacidosis). Each type of metabolic acidosis had different consequences and managements. Mineral acidosis managements included rapid elimination from the body (by diuretic or renal replacement therapy), or alkalinization (e.g. bicarbonate administration). For example, in hyperchloremic acidosis, inorganic acid has to be disposed through the kidney.10 SID can be influenced by renal excretion and electrolyte contents inside the body; therefore, subjects requiring hemodialysis were excluded. Creatinine and BUN level was highly varied between two groups, but they did not differ significantly. It showed that renal function and its direct influences in metabolic acidosis were comparable in this study.5,11 Albumin is an nonvolatile weak acid, controlled by the liver and dominated by the albumin. Thus, subjects with liver failure were excluded. Since both groups showed no significant difference of liver function test, which was also proven by similar albumin concentrations within a normal range, albumin level was not considered to affect the acidosis. There was no difference in the severity of liver and kidney dysfunction that could impact SID between both groups.
As mentioned earlier, there was pCO2, albumin effect, and UA effect, in which each of them contributes to the SBE value. pCO2 was influenced by ventilation, but subjects requiring mechanical ventilation were excluded in this study. If albumin effect and UA effect were neglected, SBE value in the BES group would have more superior result than the NS group. This could be attributed to SID in the BES group was significantly higher than in the NS group. Nevertheless, even though SID in the BES group was significantly higher at all time points, this study found that SBE in the BES group was only significantly higher at 18, 24, and 48 hours than in the NS group. This might be due to the higher unmeasured anion factor in the BES group than in the NS group. Unmeasured anion as the one resulted from cell metabolisms, for instance lactate, ketone bodies, and phosphate, or anions acquired from the environment, such as salicylate and methanol. In the BES group, there was one subject with creatinine level ≥4 mg/ dL, one subject with creatinine level 3–4 mL/ dL, and three subjects with creatinine level 2–3 mg/dL. Meanwhile, in the NS group there were four subjects with creatinine level 2–3 mg/ dL. Therefore, subjects in the BES group were suspected to have signs of renal insufficiency. The result of this renal insufficiency was deposition of unmeasured anions, such as sulfate and phosphate, which created masking effect of SID to SBE. The other cause of insignificant SBE difference in the earlier hours was the degree of sepsis severity between two groups, which were not standardized in this study. Septic mediators as the primary cause of DKA also played a role in contributing unmeasured anions such as lactate to acidosis condition.11 This explained the non-significant mean pH difference between the two groups in our study. The pH is a weak endpoint of diabetic ketoacidosis resolution since it was influenced by respiratory alkalosis due to hyperventilation in sepsis condition, loss chloride due to vomiting or large gastric residual volume that common in diabetic gastroparesis.5
Both groups had nearly similar characteristics. Mean MAP between the two groups was relatively adequate (>65 mmHg) with no significant difference, except mean MAP at 24 hours. No significant difference between the two types of fluid resuscitation was observed due to the isotonic crystalloid solution of both fluids. Additionally, there was no total volume difference between two groups. There was no significant mean CVP difference between the two groups, except at six hours. This occurred due to similar characteristics between two types of solution, which were isotonic to plasma and similar total volume given to the subjects.4,8 The distribution of lactate level was varied although there was no significant difference between both groups. This might be attributable to the two types of solution; normal saline and BES, did not contain any lactate. Lactate and ketone bodies were monitored in this study. There was no significant differences of both anions in both groups. Lactate in both groups had wide variability: 1.1–20 mmol/L to 0.9–2 mmol/L in the NS group, and 1.2–14.6 mmol/L to 0.8–6.9 mmol/L towards the end in the BES group. These wide variabilities were due to tissue hypoperfusion, causing ineffective cell metabolism.9,11
There was no significant mean random blood glucose (RBG) and mean ketone bodies difference between both groups at every hour during interventions. Five subjects had recurring diabetic ketoacidosis after 48 hours (two subjects in each group died within 28 days and one subject died within 48 hours), caused by the discontinued insulin therapy (78%) as the most cause of DKA in this study, other than infection, and non-infection medical illness.12,13 All of them received sodium bicarbonate due to pH less than 7.1 following diabetic ketoacidosis protocol in this study and died within 28 days. One subject suffered from cardiopulmonary arrest following sodium bicarbonate administration. This should be handled carefully because increased pH would shift the dissociation curve to the left, diminishing tissue oxygen delivery. Fluid overload (intrvascular volume expansion) due to hypernatremia, which might also cause mortality.10,13
A limitation of this study is the baseline of SID in the BES group is higher than in the NS group; therefore, the superiority of BES could not be concluded based on significant mean actual SID and SBE, delta SID and BES. Other limitations are the small number of subjects and a single institution. BES could be utilized as an alternative fluid resuscitation, but it should be reviewed further in a larger population and other hospitals or institutions with different protocol.
In conclusion, fluid resuscitation of DKA patients with BES results in a significantly higher SBE and SID means as compared to NS. However, the higher delta SBE and SID were not significant, suggested that BES as an alternative fluid was not superior to NS in preventing hyperchloremic acidosis in diabetic ketoacidosis patients.
Conflict of Interest
The authors affirm no conflict of interest in this study.
Acknowledgment
None.
REFERENCES
- Kitabchi AE, Umpirezz GE, Miles JM, Fisher JN. Hyperglycemic crisis in adult patients with diabetes. Diabetes Care. 2009;32(7):1335–43.
- Diabetes.org.uk [Internet]. Joint british diabetes societies inpatient care group. The management of diabetic ketoacidosis in adult [update: 2013 Sep; cited 2014 Nov]. Available from: http://www.diabetes.org. uk/Documents/Adults/Guidelines.htm).
- Scheingraber S, Rehm M, Sehmisch C, Finsterer U. Rapid saline infusion produces hyperchloremic acidosis in patients undergoing gynecologyc surgery. Anesthesiology. 1999;90(5):1265–70.
- Mahler SA, Conrad SA, Wang H, Arnold TC. Resuscitation with balanced electrolyte solution prevents hyperchloremic metabolic acidosis in patient with diabetic ketoacidosis. Am J Emerg Med. 2011;29(6):670–4.
- Van Zyl DG, Rheeder P, Delport E. Fluid management in diabetic-acidosis--Ringer’s lactate versus normal saline: A randomized controlled trial. QJM. 2012;105(4):337–43.
- Park M, Noritomi DT, Maciel AT, de Azevedo LC, Pizzo VR, da Cruz-Neto LM. Partitioning evolutive standard base excess determinants in septic shock patients. Rev Bras Ter Intensiva. 2007;19(4):437–43s.
- Stewart PA. Modern quantitative acid-base chemistry. Can J Physiol Pharmacol. 1983;61(12):1444–61.
- Bellomo R, Naka T, Baldwin I. Intravenous fluids and acid base balance. Contrib Nephrol. 2004;144:105–18.
- Badr A, Nightingale P. An alternative approach to acid base abnormalities in critically ill patients. Contin Educ Anaesth Crit Care . 2007:7(4):107–11.
- Kellum JA. Determinants of blood pH in health and disease. Crit Care. 2000;4(1):6–14.
- Levraut J, Grimaud D. Treatment of metabolic acidosis. Curr Opin Crit Care. 2003;9:260–5
- Randall L, Begovic J, Hudson M, Smiley D, Peng L, Pitre N, et al. Recurrent diabetic ketoacidosis in inner-city minority patients: behavioral, socioeconomic, and psychosocial factors. Diabetes Care. 2011;34(9):1981–96.
- Price DA. Case study: recurrent diabetic ketoacidosis resulting from spurious hypoglycemia: a deleterious consequence of inadequate detection of partial strip filling by a glucose monitoring system. Clinical Diabetes. 2009;27(4):164–6.
Copyright @ 2017 Authors. This is an open access article distributed under the terms of the Creative Commons Attribution-NonCommercial 4.0 International License (http://creativecommons.org/licenses/by-nc/4.0/), which permits unrestricted non-commercial use, distribution, and reproduction in any medium, provided the original author and source are properly cited.
mji.ui.ac.id