Section Abstract Introduction Methods Results Discussion Conflict of Interest Acknowledgment References
Clinical Research
Assessment of the nutrient intake and micronutrient status in the first trimester of pregnant women in Jakarta
pISSN: 0853-1773 • eISSN: 2252-8083
https://doi.org/10.13181/mji.v26i2.1617 Med J Indones. 2017;26:109–15
Received: October 20, 2017
Accepted: April 22, 2017
Author affiliation:
1 Department of Obstetrics and Gynecology, Faculty of Medicine, Universitas Indonesia, Cipto Mangunkusumo Hospital, Jakarta, Indonesia
2 Department of Nutrition, Faculty of Medicine, Universitas Indonesia, Cipto Mangunkusumo Hospital, Jakarta, Indonesia
3 Faculty of Medicine, Universitas Indonesia, Cipto Mangunkusumo Hospital, Jakarta, Indonesia
Corresponding author:
Rima Irwinda
E-mail: rima.irwinda@yahoo.com
Background
Maternal nutrition before and during pregnancy is important for a healthy pregnancy outcome. According to National Basic Health Research (Riskesdas) 2013, 24.2% of pregnant women are at risk of chronic malnutrition and 37.1% of them suffer from anemia. The aim of this study was to obtain information about the nutrient intake and serum micronutrient status in the first trimester of pregnant women in Jakarta.
Methods
A descriptive study was conducted towards 234 pregnant women with gestational age no more than 14 weeks. The nutrient intake data was obtained from the conversion of frequency food questionnaire (FFQ) which was semi quantitative data using a Nutrisurvey application. The maternal serum was examined to obtain data about nutrient level.
Results
The mean of daily maternal energy intake was 1,256.1 kcal. Most subjects had nutrient intake below the recommendations of Institute of Medicine (IOM) and recommended dietary allowances (RDA), i.e. energy (88.9%), protein (80.8%), iron (85%), folic acid (74.8%), calcium (90.6%), and zinc (94.9%). However, they showed a high intake level of vitamin A (70.5%). Most subjects had deficiency in vitamin A (69.7%), vitamin D (99.6%), and zinc (81.2). No correlation was found between the maternal nutrient intake and nutritional status.
Conclusion
Most of the first-trimester-pregnant-women in Jakarta had low maternal energy and nutrient intake, except for vitamin A, as well as low serum vitamin A, vitamin D, and zinc level.
Keywords
first trimester, nutrient intake, nutritional status, pregnancy
Maternal nutrition before and during pregnancy is important for a healthy pregnancy outcome. The first trimester is the most critical period because during this first 13 weeks, conception, implantation, and organogenesis take place. Deficiencies of macro and micronutrient potentially give negative effects to health of the mother and the fetus. Suboptimal nutrient status has been found to lead to miscarriage, intrauterine growth restriction, preeclampsia, infection, preterm delivery, low birth weight, and anemia. Furthermore, it increases the risk of maternal and neonatal mortality.1,2
Maternal nutrition has also major effects on the long term health of the children including ‘programming’ of non-communicable disorders. Many studies have proven that the first 1,000 days of life (during pregnancy and the first two years of life) is a crucial period for optimizing the growth and the development of children. Good nutrition and healthy growth at this period would give lasting benefits throughout life.3,4
Dietary energy and nutrient requirements during pregnancy are generally increased to support the growing fetus, placenta, and maternal tissues. However, according to a systematic review,5,6 macronutrient and micronutrient intakes of pregnant women in developing countries were generally below recommendations. Deficiencies of micronutrients such as iron, vitamin A, folate, and iodine are common during pregnancy.1 Globally maternal undernutrition, including chronic energy and micronutrient deficiencies, is prevalent in many regions. Maternal undernutrition (body mass index <18.5 kg/m²) varied from 10–19% in most countries.7 Based on the 2011 estimates, the prevalence of anemia in pregnant women worldwide was 38%.7 In Indonesia, 37.1% of pregnant women were anemic and 24.2% were at risk of chronic energy deficiency.8
The aim of this study was to assess nutrient intake and serum micronutrient status in the first trimester of pregnant women in Jakarta.
METHODS
The data obtained in this study was secondary data from two previous interventional studies conducted in Cipto Mangunkusumo Hospital and Budi Kemuliaan Hospital, Jakarta, during February 2012 to April 2015. The collection of data was approved by the Ethical Committee for Research in Human from the Faculty of Medicine, Universitas Indonesia (No. 480/PT02. FK/ETIK/2012 and No. 71/H2.F1/ETIK/2013). After written consent was obtained, 234 subjects were included in this study, with the inclusion criteria were women with no more than 14 weeks of gestational age without congenital anomaly (confirmed by ultrasound examination), agreed to participate, did not take any pregnancy milk nor supplementation, and was not enrolled in any other interventional study. The exclusion criteria were subjects with hyperemesis gravidarum, women with intrauterine fetal death, and abortion.
The data presented were nutrient intake from subjects’ recall using semiquantitative frequency food questionnaire (FFQ) for a month and blood test results of blood count and nutrient level. FFQ was assessed by two trained nutritionists using food model, and it was converted into certain nutrient intake using the Nutrisurvey version 2007 program with food database from Indonesia. The maternal serum was assessed in Prodia laboratory. The iron serum was assessed by (National Institute of Occupational Safety and Health (NIOSH)), serum zinc by inductively coupled plasma mass spectroscopy (ICP-MS) (Inductively Coupled Plasma Mass Spectroscopy), serum vitamin A by high performance liquid chromatography (HPLC) (High Performance Liquid Chromatography), serum vitamin diasorin (D) by clinical laboratory improvement amendments (CLIA) (Clinical Laboratory Improvement Amendments), serum vitamin B12 by HPLC, and serum folic acid by HPLC. The data was then analyzed by statistical package for the social sciences (SPSS) (Statistical Package for the Social Sciences) statistics data editor version 20. The normality of variables was tested using a Kolmogorov-Smirnov test. Data with normal distribution was then summarized by means and standard deviations and by medians and minimum-maximum values for data with abnormal distribution. Classification, and correlation between variables were analyzed using a Spearman or Pearson test. The classification of nutrient intake and serum level was based on the criteria of Institute of Medicine9 and recommended dietary allowances (RDA).9,10
RESULTS
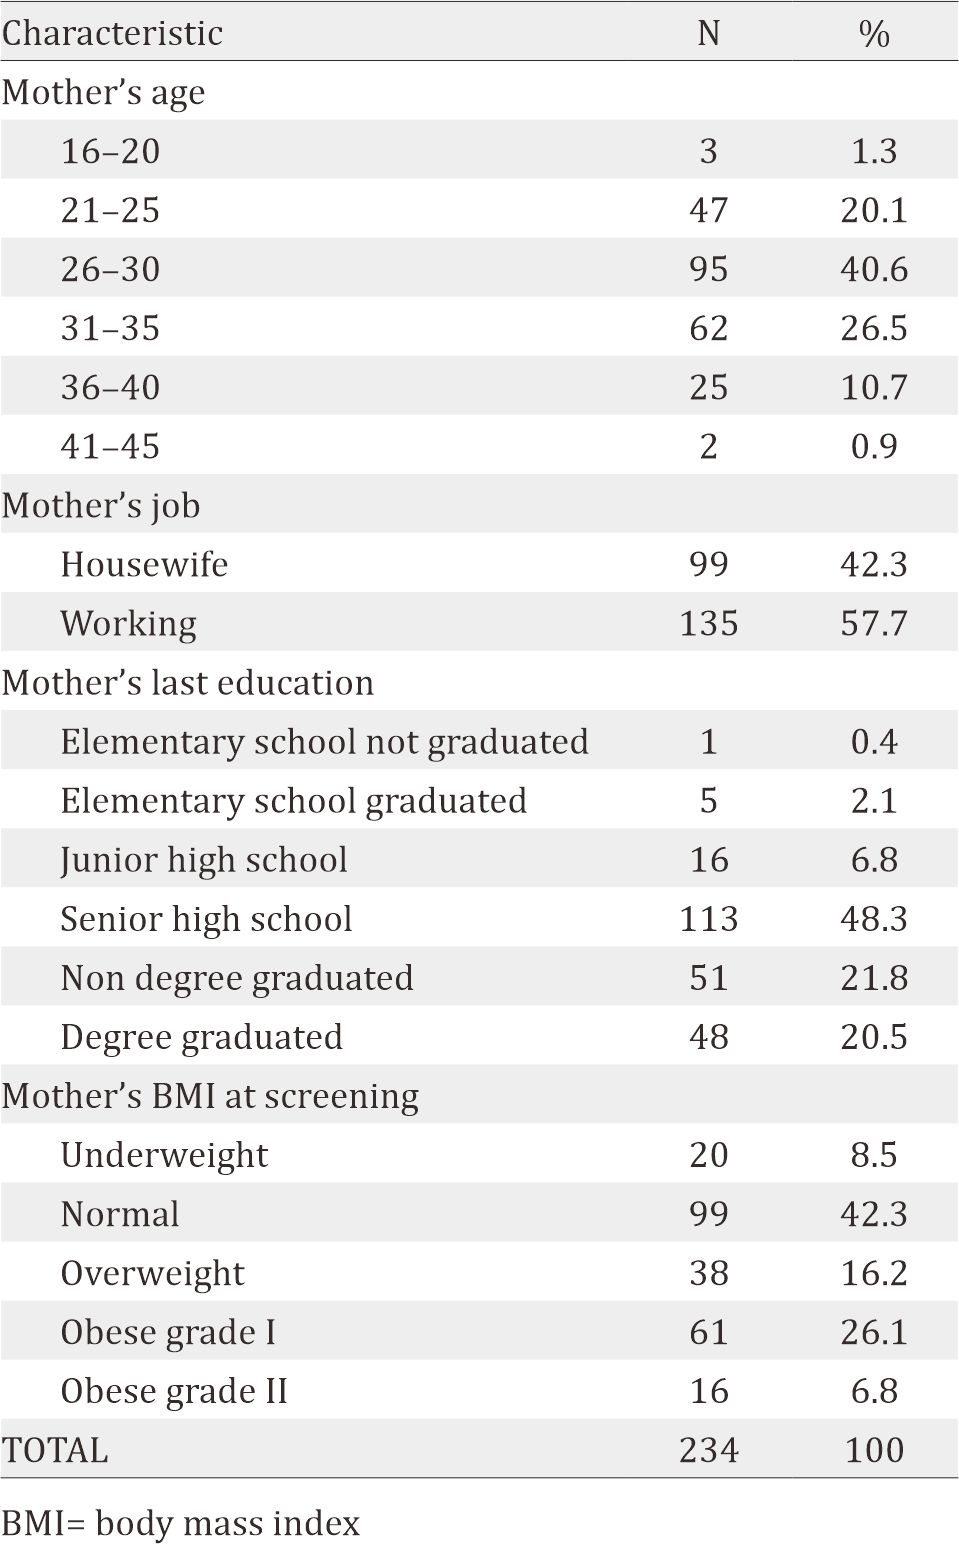
The data of 234 subjects were analyzed. The characteristics of the subjects are shown in Table 1. 40.6% of the subjects were in the age group of 26–30 years old, 57.7% had jobs, 90.6% had graduated from high schools i.e. were considered high educated, and 42.3% had normal body mass index (BMI).
Table 1. Characteristics of the subjects
The maternal nutrient intake is shown in Table 2. The median of daily energy intake is 1,256.1 Kcal. 208 subjects (88.9%) had energy intake below RDA 2013 recommendation. Most subjects also had low intake of other nutrients, i.e. protein (80.8% of the subjects), iron (85%), folic acid (74.8%), calcium (90.6%), and zinc (94.9%). Most of them had high daily intake of vitamin A (70.5 %).
Table 2. Maternal nutrient intake, blood and nutrient status
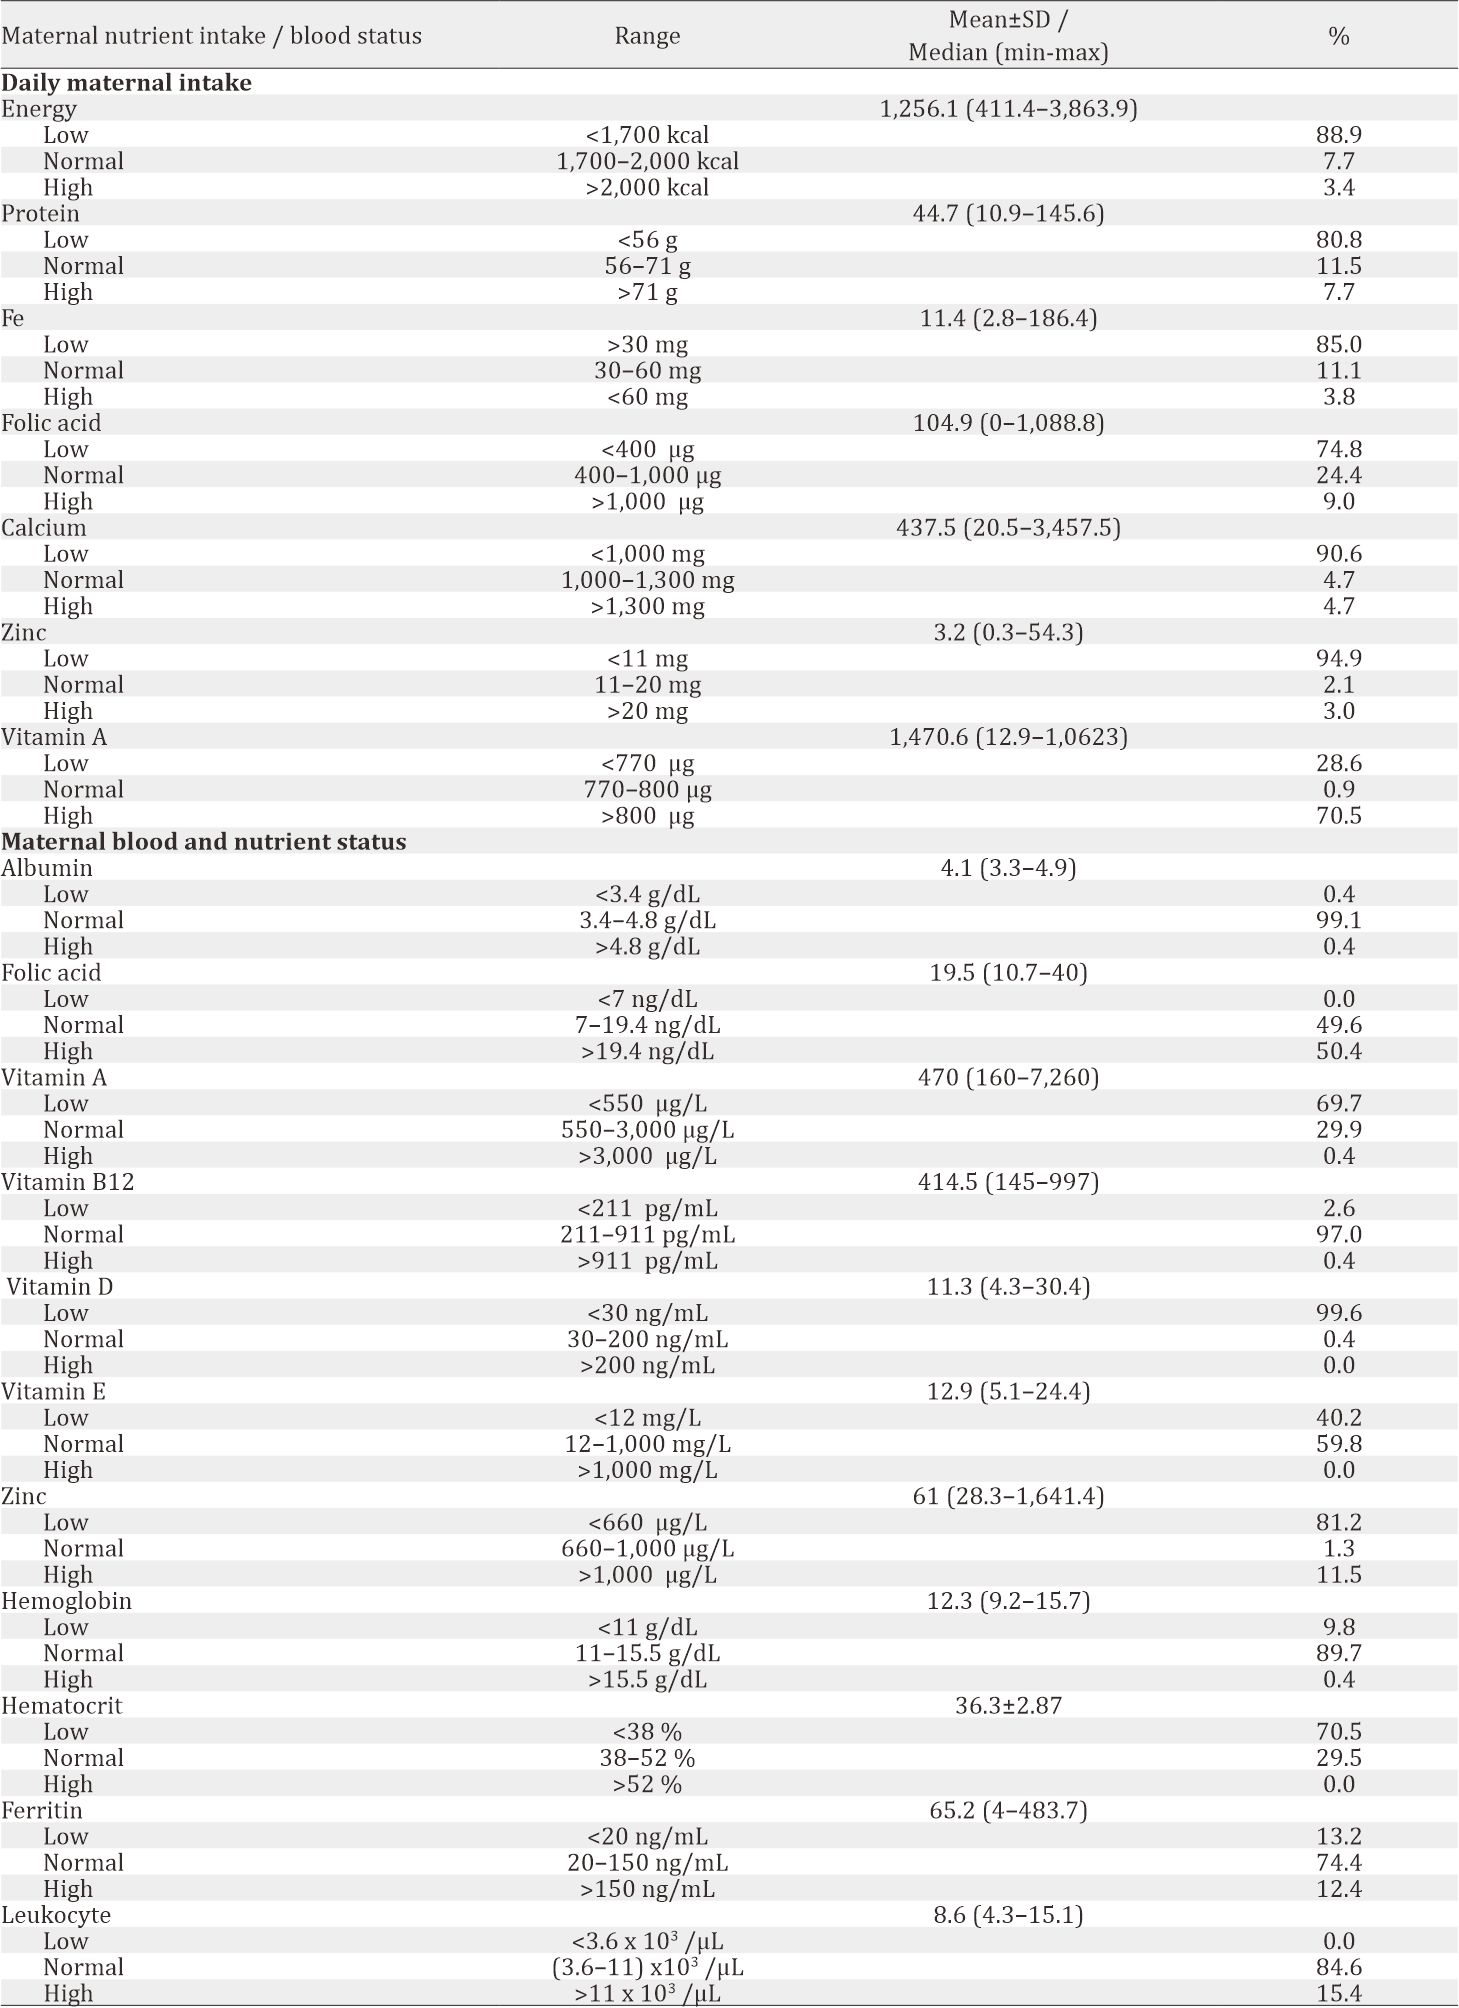
Maternal blood and nutrient status are shown in Table 3. Most of the subjects had deficiency in vitamin A (69.7%), vitamin D (99.6%), and zinc (81.2%), while folic acid level was distributed evenly (normal 49.6%, high 50.4%). Significant correlation was found between albumin and hemoglobin level (r=0.34, p<0.001). Using a comparative test, a significant difference was found between BMI with hemoglobin level (p=0.023), hematocrit level (p=0.005), and leukocyte level (p=0.004). However, no significant correlation was found between maternal nutrient intake and its blood nutrient status, such as protein, folic acid, iron, zinc, and vitamin A, as shown in Table 4.
Table 3. Correlation between maternal intake and blood nutrient status
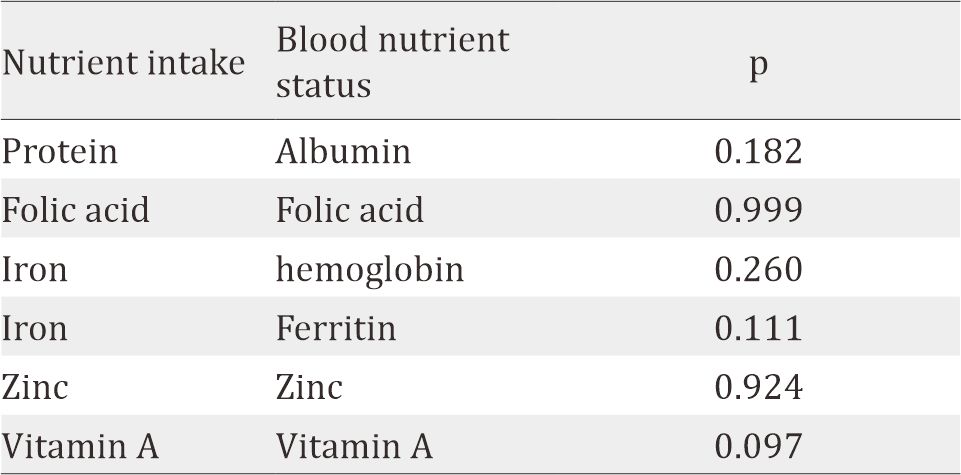
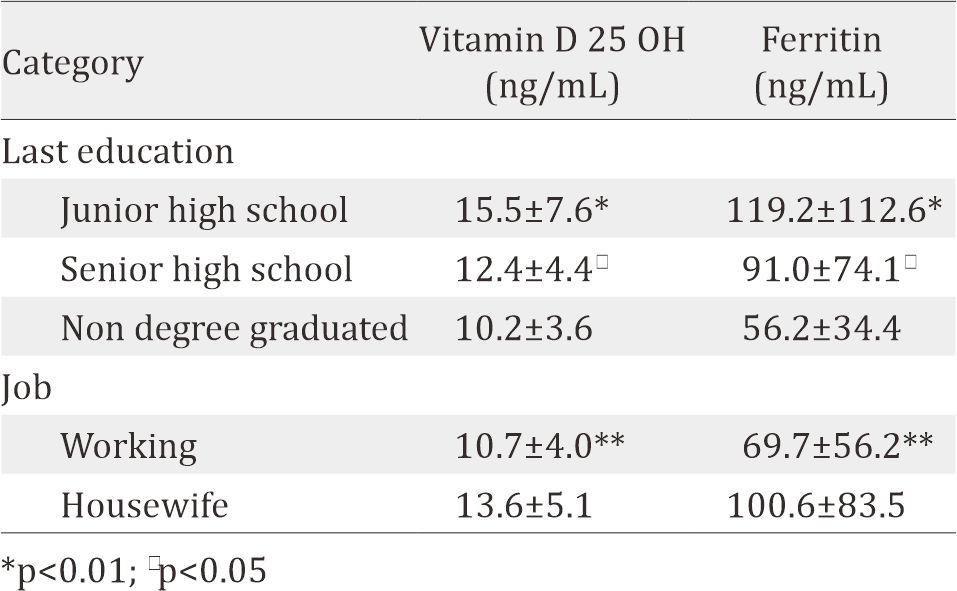
Table 4. Correlation between mother’s education and job to clinical variable
As determined by one-way ANOVA, there was statistically significant difference in the mean of iron intake between different ages of mothers. The Tukey post hoc revealed that iron intake was lower in mothers of 26–30 years old (16.7±21.8 mg/day, p=0.042) compared to the group of 31–35 years old (27.3±29.7 mg/day).
Using independent samples T-test, this study found that junior and senior high school graduates had higher blood 25-hydroxy vitamin D (25(OH)D) and ferritin level compared to nondegree graduates. Working mothers, compared to housewives, also had significantly lower level of blood vitamin D 25 OH and blood ferritin level. Meanwhile there are no correlation between mother's education and job to other variable, e.g. albumin, folic acid, vitamin A, vitamin B12, vitamin E, zinc, haemoglobin, hematocrit and leucocyte (p<0.05).
DISCUSSION
Data from FFQ showed mostly low intake of energy, protein, iron, folic acid, calcium, and zinc. This result was consistent with researches conducted in other developing countries. The average calories intake of developing countries according to Food and Agriculture Organization (FAO) (Food and Agriculture Organization)are 2850 kcal/day, 2940 kcal/day in the world, and 3440 kcal/day in industrialized countries.11 But with the vast range of calories intake (411.4–3,863.9) and 32.9% of the subjects were classified obese. These data showed the double burden of developing countries; undernutrition along with increasing rates of obesity. The shift of food system also influences the food selection, with easier access to “empty calorie” foods and beverages. Thus, it explains the low intake of micronutrients.12 Choosing micronutrient-dense foods can be challenging due to the access and expensive prices.13
Despite the low nutrition intake, no correlation was found between nutrition intake and serum level. This might be caused by several factors. FFQ was used to measure subjects’ intake with its validity limitation. FFQ is a subject-dependent tool with various strength (correlation coefficient) for each nutrient measured.14,15 Several nutrients from FFQ were measured without taking fortified nutrients into account. Fortification program in Indonesia consists of fortified salt with iodine; flour with iron, zinc, folic acid, vitamin B1 and B2; cooking oil with vitamin A; and rice with iron.16
The food database had included vitamin A, i.e. fortificant in palm oil, and no other fortificant was found in food vehicles such as flour and rice. The palm oil consumption was measured by estimating how much fried-food was consumed. It was assumed that this was not an objective measurement. Therefore, the high intake of vitamin A of most subjects was questioned, and no correlation was found between vitamin A intake and serum level.
The result showed that from 234 subjects, 70.5% subjects had low level of vitamin A. Vitamin A deficiency has been recognized as a health issue in developing countries. Another study reported that among 107.4 million of pregnant women in regions of the world, 7.2 million (6.7%) have deficient vitamin A status (serum or breastmilk retinol concentrations <0.70 μmol/L) and 13.5 million (12.5%) have low vitamin A status (0.70–1.05 μmol/L). The risk factors for vitamin A deficiency are poor nutritional status, a low dietary intake in sources of vitamin A (eggs, dairy products, fruits and vegetables), and a high rate of infections, particularly measles, diarrhea and respiratory tract infections.17, 18
The study found that almost all the subjects had low vitamin D level (99.6%). Only one subjects had normal vitamin D level. The deficiency of vitamin D is quite prevalent worldwide, particularly in Asia countries. The prevalence of vitamin D deficiency was over 70% in South Asia and ranged from 6% to 70% in Southeast Asia. The important determinants for the vitamin D levels are dietary intake and skin synthesis that is dependent on the sunlight exposure, latitude, skin pigmentation, skin coverage, and use of sunscreen. Although South and Southeast Asia countries get sunshine throughout the year, the prevalence vitamin D deficiency in these countries that is closer to the equator is higher. This can be caused by skin pigmentation. Populations in closer area to the equator (warmer climates) tend to have greater skin pigmentation which can decrease the ability of the skin to synthesis vitamin D. It is because in dark pigmentation, ultraviolet (UV) light cannot reach the appropriate layer of the skin for the synthesis of vitamin D. Skin contains 7-dehydrocholesterol which on exposure to UV light in sunshine gets converted to cholecalciferol (Vitamin D3).19–21
In this study, no subject had low level of folic acid. All the subjects had normal or high folic acid level despite the low level of folic acid intake. It might be caused by the fortification of flour with folic acid that has not been included into FFQ data base. The fortification of flour with folic acid has been done in many countries around the world, including Indonesia (200 μg/100 g flour), which is regulated by the Ministry of Health. This mandatory fortification is expected to reduce the prevalence of neural tube defect births.16,17
Our finding showed significant correlation between albumin and hemoglobin. It supported the theory of protein as requirements of hemoglobin synthesis.22 The significant difference of BMI status with hemoglobin and hematocrit level showed that the underweight group was more anemic than other BMI groups. This might be caused by lower intake of food and iron.23 A significant difference was found between different BMI status with leukocyte level, showing an increasing trend of leukocyte counts in higher BMI. This could be due to the high release of proinflammatory factor such as tumor necrosis factor-α (TNF-α) and interleukin 6 (IL-6) found in obese patient, causing increased production of leukocytes.24
We acknowledged several limitations in this study. Firstly, the population scope was limited in Central Jakarta that did not represent thoroughly the population of Jakarta. Secondly, the economic factor such as family’s income level was not evaluated in this study. And thirdly, the FFQ method was performed in reliance with subjects’ memory, rendering it was less objective although food model was used to reduce bias.
Further study involving broader scope of population is needed to obtain more representative data. For the first-trimesterpregnant- women, we recommend to take multimicronutrient supplementation to improve nutrient intake and status.
In conclusion, most of the first-trimester-pregnantwomen in Jakarta had low maternal energy and nutrient intake, except for vitamin A, and most of them had low vitamin A, vitamin D, and zinc level.
Conflicts of Interest
The authors confirm no conflict of interest in this study.
Acknowledgment
None.
REFERENCES
- www.who.int [Internet]. Nutrition counselling during pregnancy. [Update 2016; Cited 2016 Oct] Available from: http://www.who.int/elena/bbc/nutrition_ counselling_pregnancy/en/
- Haider BA, Bhutta ZA. Multiple-micronutrient supplementation for women during pregnancy. Cochrane Database Syst Rev. 2012;11(CD004905):1–127.
- Brenseke B, Praater MR, Bahamonde J, Gutierrez JC. Current thoughts on maternal nutrition and fetal programming of the metabolic syndrome. J Pregnancy. 2013;2013(368461):1–13.
- Black RE, Alderman H, Bhutta ZA, Gillespie S, Haddad L, et al. Maternal and child nutrition: building momentum for impact. The Lancet. 2013;382(9890):372–5.
- Blumfield ML, Hure AJ, Macdonald- Wicks L, Smith R, Collins CE. Systematic review and meta-analysis of energy and macronutrient intakes during pregnancy in developed countries. Nutr Rev. 2012;70(6):322–36.
- Blumfield ML, Hure AJ, Macdonald- Wicks L, Smith R, Collins CE. A systematic review and metaanalysis of micronutrient intakes during pregnancy in developed countries. Nutr Rev. 2013;71(2):118–32.
- Stevens GA, Finucane MM, De-Regil LM, Paciorek CJ, Flaxman SR, Branca F, et al. Global, regional, and national trends in total and severe anaemia in children and pregnant and non-pregnant women for 1995–2011: a systematic analysis of population-representative data. Lancet Glob Health. 2013;1(1):e16–25.
- www.depkes.go.id [Internet]. Riset Kesehatan Dasar (Riskesdas) 2013. [Update 2013; Cited 2016 Oct]. Jakarta: Kementerian Kesehatan; 2013. PageAvailable from: http://www.depkes.go.id/resources/download/ g e n e r a l / H a s i l % 2 0 R i s k e s d a s % 2 0 2 0 1 3 . p d f . … Indonesian.
- www.gizi.depkes.go.id [Internet]. Peraturan Menteri Kesehatan Republik Indonesia Nomor 75 tahun 2013 tentang Angka Kecukupan Gizi yang dianjurkan bagi bangsa Indonesia. Jakarta: Kementerian Kesehatan; 2013. Available from: www.gizi.depkes.go.id>PMK75-2013.
- www.nationalacademies.org. Weight gain during pregnancy-Reexamining the guidelines. Washington DC: The National Academic Press. 2009.
- www.fao.org [Internet]. Global and regional food consumption patterns and trends. In: Diet, Nutrition, and the Prevention of Chronic Diseases. [Update 20013; Cited 2016 Oct]. Available from: Page http://www.fao. org/docrep/005/ac911e/ac911e05.htm.
- Popkin BM, Adair LS, Ng SW. Now and then: the global nutrition transition: the pandemic of obesity in developing countries. Nutr Rev. 2012;70(1):3–21.
- www.unicef.org [Internet]. Micronutrients. [uUpdate Dec 2015; Cited 2016 Oct Oct] 15. Available from: http://www.unicef.org/nutrition/index_iodine.html.
- Streppel MT, de Vries JHM, Meijboom S, Beekman M, de Creaen AJM, Slagboom PE, et al. Relative validity of the food frequency questionnaire used to assess dietary intake in the Leiden Longevity Study. Nutrition J. 2013;12:75.
- Isihara J, Yamamoto S, Iso H, Inoue M, Tsugane S. Validity of a self-administered food frequency questionnaire (FFQ) and its generalizability to the estimation of dietary folate intake in Japan. Nutrition J. 2005;4:26.
- www.kfindonesia.org [Internet]. Makanan yang dapat difortifikasi. [Update 2011; Cited 2016 Oct] Available from: http://kfindonesia.org/beta/index.php?pgid=11 &contentid=13&lang=ind.
- www.who.int [Internet]. Guidelines on food fortification with micronutrients. France: World Health Organization. [update 2006; cited 2016 Oct]. Page Available from: http://apps.who.int/ iris/bitstream/10665/43412/1/9241594012_eng. pdf?ua=1.
- West KP Jr. Extent of vitamin A deficiency among preschool children and women of reproductive age. J Nutr. 2002;132(9 Suppl):2857–66.
- Masood SH, Iqbal MP. Prevalence of vitamin D deficiency in south asia. Pak J Med Sci. 2008;24(6):891–7.
- Edwards MH, Cole ZA, Harvey NC, Cooper C. The global epidemiology of vitamin D status. J Aging Res Clin Prac. 2014;3(3):148–58.
- Nimitphong H, Holick MF. Vitamin D status and sun exposure in Southeast Asia. Dermatoendocrinol. 2013;5(1):34–7.
- Scholl TO. Maternal iron status: relation to fetal growth, length, of gestation and the neonate’s iron endowment. Nutr Rev. 2011;69(Suppl1):523–9.
- Hemamalini J. Anemia in relation to body mass index and waist circumference among Andhra Pradesh Women. J Obes Weight Loss Ther. 2011;3(173):1–3.
- Shastri N, Paunikar VM, Baig MNH. Association of obesity with total leukocyte count in patients of metabolic syndrome. Int J Biol Med Res. 2012;3(1):1399–401.
Copyright @ 2017 Authors. This is an open access article distributed under the terms of the Creative Commons Attribution-NonCommercial 4.0 International License (http://creativecommons.org/licenses/by-nc/4.0/), which permits unrestricted non-commercial use, distribution, and reproduction in any medium, provided the original author and source are properly cited.
mji.ui.ac.id