Section Abstract Introduction Methods Results Discussion Conflict Of Interest Acknowledgment References
Community Research
Association between parental socio-demographic factors and declined linear growth of young children in Jakarta
pISSN: 0853-1773 • eISSN: 2252-8083
https://doi.org/10.13181/mji.v26i4.1819 Med J Indones. 2017;26:286–92
Received: February 6, 2017
Accepted: October 14, 2017
Author affiliation:
1 Department of Child Health, Faculty of Medicine, Universitas Indonesia, Jakarta, Indonesia
2 Faculty of Medicine, Universitas Indonesia, Jakarta, Indonesia
Corresponding author:
Hartono Gunardi
E-mail: hartono@ikafkui.net
Background
In Indonesia, approximately 35.5% of children under five years old were stunted. Stunting is related to shorter adult stature, poor cognition and educational performance, low adult wages, lost productivity, and higher risk of nutrition-related chronic disease. The aim of this study was to identify parental socio-demographic risk factors of declined linear growth in children younger than 2 years old.
Methods
This was a cohort-prospective study between August 2012 and May 2014 at three primary community health care centers (Puskesmas) in Jakarta, Indonesia, namely Puskesmas Jatinegara, Mampang, and Tebet. Subjects were healthy children under 2 years old, in which their weight and height were measured serially (at 6–11 weeks old and 18–24 months old). The length-for-age based on those data was used to determine stature status. The serial measurement was done to detect growth pattern. Parental socio-demographic data were obtained from questionnaires
Results
From the total of 160 subjects, 14 (8.7%) showed declined growth pattern from normal to stunted and 10 (6.2%) to severely stunted. As many as 134 (83.8%) subjects showed consistent normal growth pattern. Only 2 (1.2%) showed improvement in the linear growth. Maternal education duration less than 9 years (RR=2.60, 95% CI=1.23– 5.46; p=0.02) showed statistically significant association with declined linear growth in children.
Conclusion
Mother with education duration less than 9 years was the determining socio-demographic risk factor that contributed to the declined linear growth in children less than 2 years of age.
Keywords
children, maternal education, risk factor, socio-demographic, stunting
Attained height is affected by genetic and environmental factors throughout the growth period. Any problems in one of those factors may lead to stunting which is defined as length/heightfor- age below -2 SD of the World Health Organization (WHO) child growth standards median.1 Stunting is the result of inadequate nutritional intake starting from the period of conception to 24 months old.2,3 Stunting in the first 2 years will remain until adulthood; it contributes to shorter adult stature1 and is associated with other consequences, such as poor cognition and educational performance, low adult wages, lost productivity, and higher risk of nutrition-related chronic disease.2,3
Stunting is a global burden because 80% of them occur in developing countries. Southeast Asia has the second highest prevalence, and total number of children stunted are 15.6 million (29.4%). Indonesia belongs to the top 20 countries with the highest burden of malnutrition which constitutes 80% of the world’s undernourished children.4 Based on the 2010 United Nation of Children Education Fund (UNICEF) data, prevalence of stunting in Indonesia was reported to be approximately 35.5% of all children.3
Child stunting is associated with constitutional factors (e.g. maternal height, birth weight), risk factors (e.g. nutritional intake, illness), and external factors (e.g. parental education, socio-economic status, poverty). Some of external factors such as low parental education has been reported from Semarang,5 mother’s education of 24–59 months old children reported from North Sumatera province;6 parental education, family economic status has been reported from Depok,7 but there was lack of published report from Jakarta. Jakarta as the capital city of Indonesia is the most populous city in Indonesia and has a wide variation in sociodemographic background which might influence the rearing practice and eventually affects the linear growth of children. This study aimed to identify parental socio-demographic risk factors of declined linear growth in children younger than 2 years old in Jakarta.
METHODS
This prospective cohort study was conducted from August 2012 to May 2014 in Jatinegara, Tebet, and Mampang Health Centers, Jakarta, Indonesia. Subjects of this study were those of longitudinal vaccine study with one and half year interval follow-up. They were children aged <24 months, clinically healthy, born between 37 and 42 weeks of gestation with birth weight of 2,500– 4,000 g. Children with febrile or severe illness or congenital abnormalities or children with routine medical drug consumption were excluded.
This study was approved by the Health Research Ethics Committee, Faculty of Medicine Universitas Indonesia – Cipto Mangunkusumo Hospital (101/PT02.FK/ETIK/2012 and 735/H2.F1/ ETIK/2013). Informed consent was acquired from participant parents or guardians.
Demographic and anthropometric measurement
The characteristics of subjects obtained were age, sex, birth order, weight, and length. The parental socio-demographic data were age, highest education level, and occupation of the mother and father. Sociodemographic data were obtained by interview using a guided questionnaire. First measurement was conducted when subjects were 6 to 11 weeks of age, and the second measurement was at 18 to 24 months of age. Body weight was measured with minimal clothing using calibrated baby scale (Seca, Germany) with accuracy of 1 gram. Body length was measured in recumbent position using length board with accuracy of 1 mm. Recumbent length was measured while child was lying down straight along the board, head against the headboard with eyes looking straight up, body and legs straight and flat in the center of the measuring board, heels and feet firmly against the foot board. Measurement was done to the nearest mm. Anthropometric data were plotted to the 2005 WHO growth curve to determine the length-for-age (LFA).
Interpretation of LFA was as follow: (1) normal if LFA z-scores between –2 to +3; (2) stunted if LFA z-score between –2 to –3 z-scores; and (3) severely stunted if LFA z-scores ≤–3 SD. Linear growth was assessed as follow: (1) constant if there was no increment or decrement of LFA z-scores between two measurements; (2) inclined or declined if there was an increment or decrement of LFA which passed –2 z-scores, respectively.
Statistical analysis
Data were analyzed using Statistical Package for the Social Sciences (SPSS) version 21.0. Dependent variable was pattern of linear growth, which was classified into (1) inclined or constant, and (2) declined. Independent variables were the socio-demographic data of subjects and parents that were classified as follows: subject’s birth order (first to second order or third order and up), parental age (20–35 years old or ≥ 35 years old), parental education duration (>9 years (senior high school or diploma/university degree) or ≤9 years (no education, primary – junior high school)), mother employment status (housewife or working), and father occupation (labor, civil servant, private sector, entrepreneur, or others).
Analysis of the association between each independent variable and dependent variable was done by Chi-square or Fisher test as appropriate, with p<0.05 considered as statistically significant. For paternal occupation with 5 subgroups, analysis was performed independently with a pattern of linear growth using Chi-square of Fisher test as appropriate. Reference group used in this analysis was the total of non-tested group. Relative risk and 95% confidence interval (CI) were calculated for each independent variable.
RESULTS
There were 258 children who participated in the first measurement, but only 160 of them participated in the second measurement. The 98 children who did not participate in the second measurement had been moved to another area due to natural heavy flood and loss of contact.
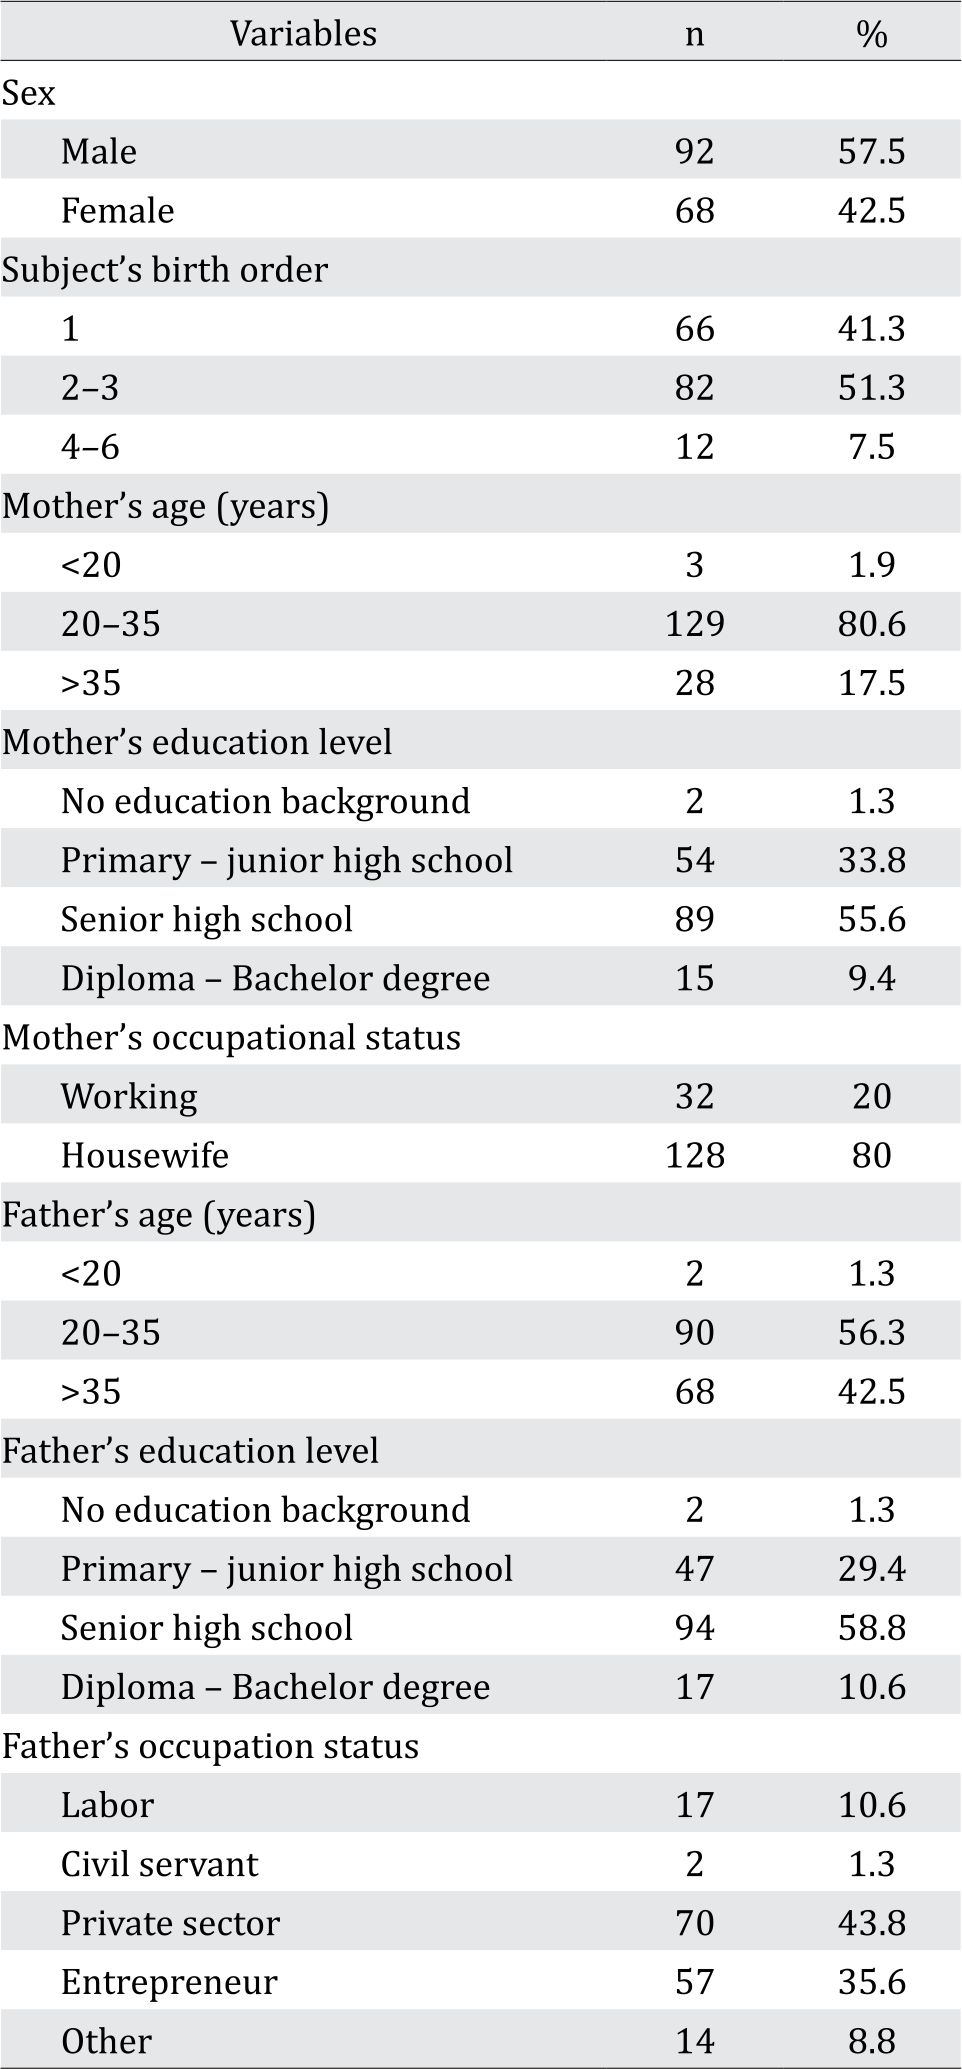
The mean and standard deviation of the subjects age were 8.0±1.6 weeks and 19.9±0.8 months in the first and second measurement respectively. High school was the highest level of education for mother (55.6%) and father (58.8%). Most of the mothers were housewives (80%), and the fathers were working in private sector (43.8%) (Tabel 1).
Table 1. Subjects characteristics and parents socio-demographic characteristics
In the first measurement, the LFA classification of 158 (98.8%) subjects were normal and 2 (1.2%) were stunted. In the second measurement, out of 160 subjects, 24 (15%) showed declined LFA; 14 of them (8.7%) declined from normal, crossed –2 z-scores and classified as stunted and the rest 10 (6.2%) crossed –3 z-score and classified as severely stunted. About 134 children (83.8%) had the same normal growth classification, and only 2 children (1.2%) inclined from stunted into normal range (Figure 1).
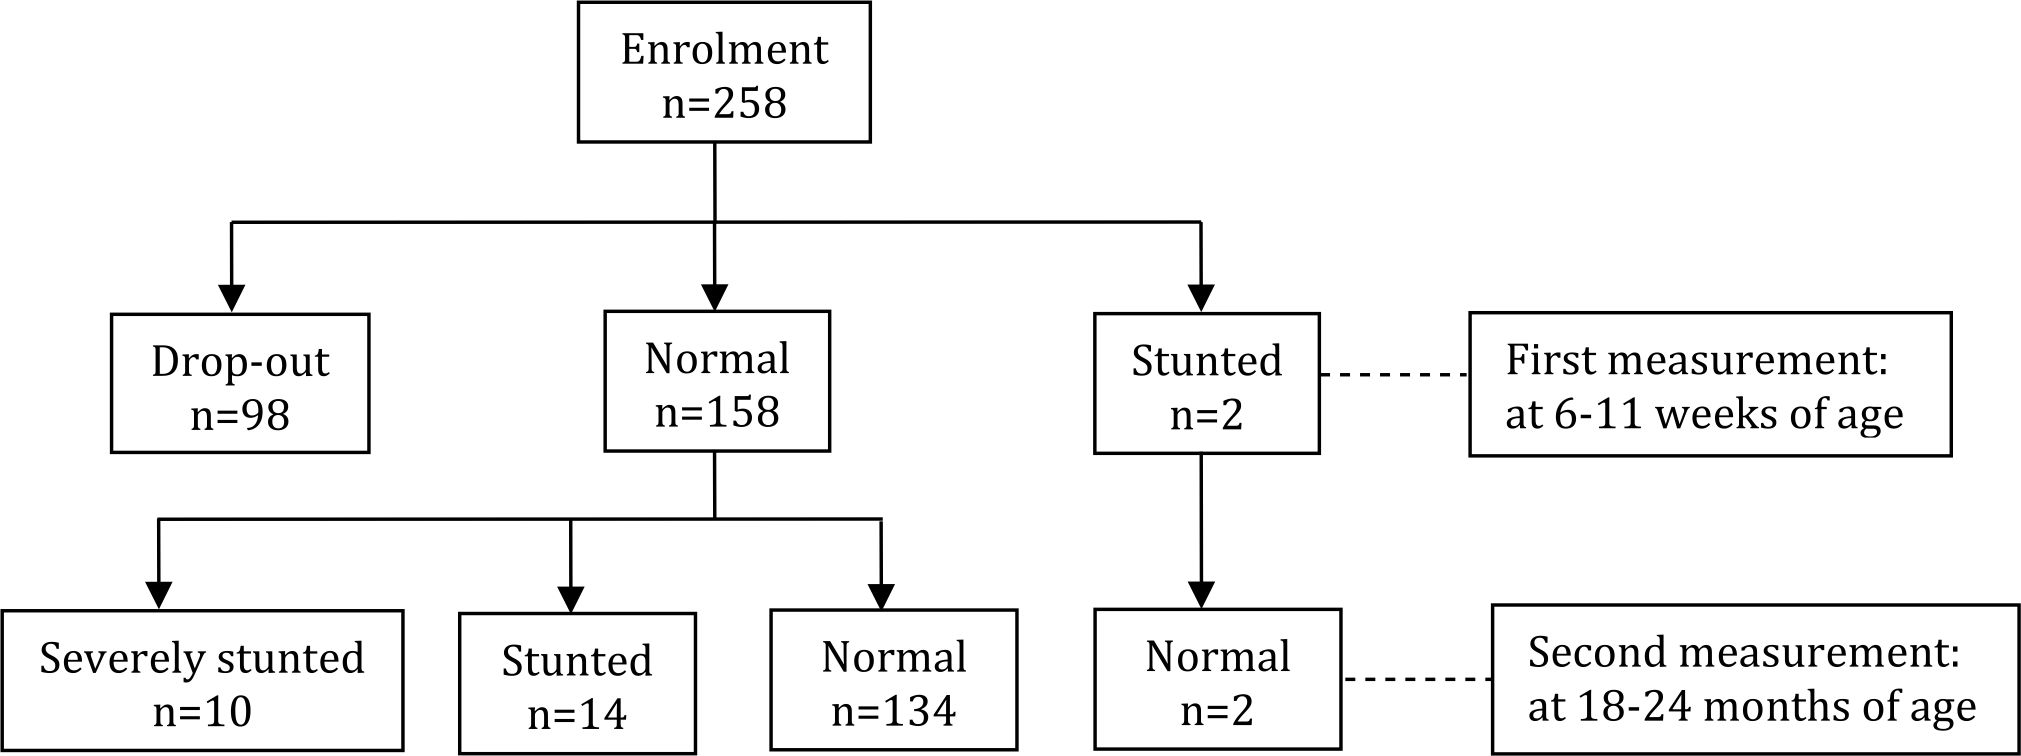
Figure 1. Subjects’ linear growth changes
Univariate analysis of the association between each independent factor and the dependent factor was presented in Table 2. Children with working mothers had about one sixth risk of declined linear growth (RR=0.17, 95% CI=0.02–1.24; p=0.05) as compared to those whose mothers were housewives. (Table 2) Paternal education duration less than 9 years was related to 1.6 times higher risk of children with declined linear growth (RR=1.61, 95% CI= 0.77–3.38; p=0.23).
Table 2. Association between socio-demographic factors and subjects’ linear growth
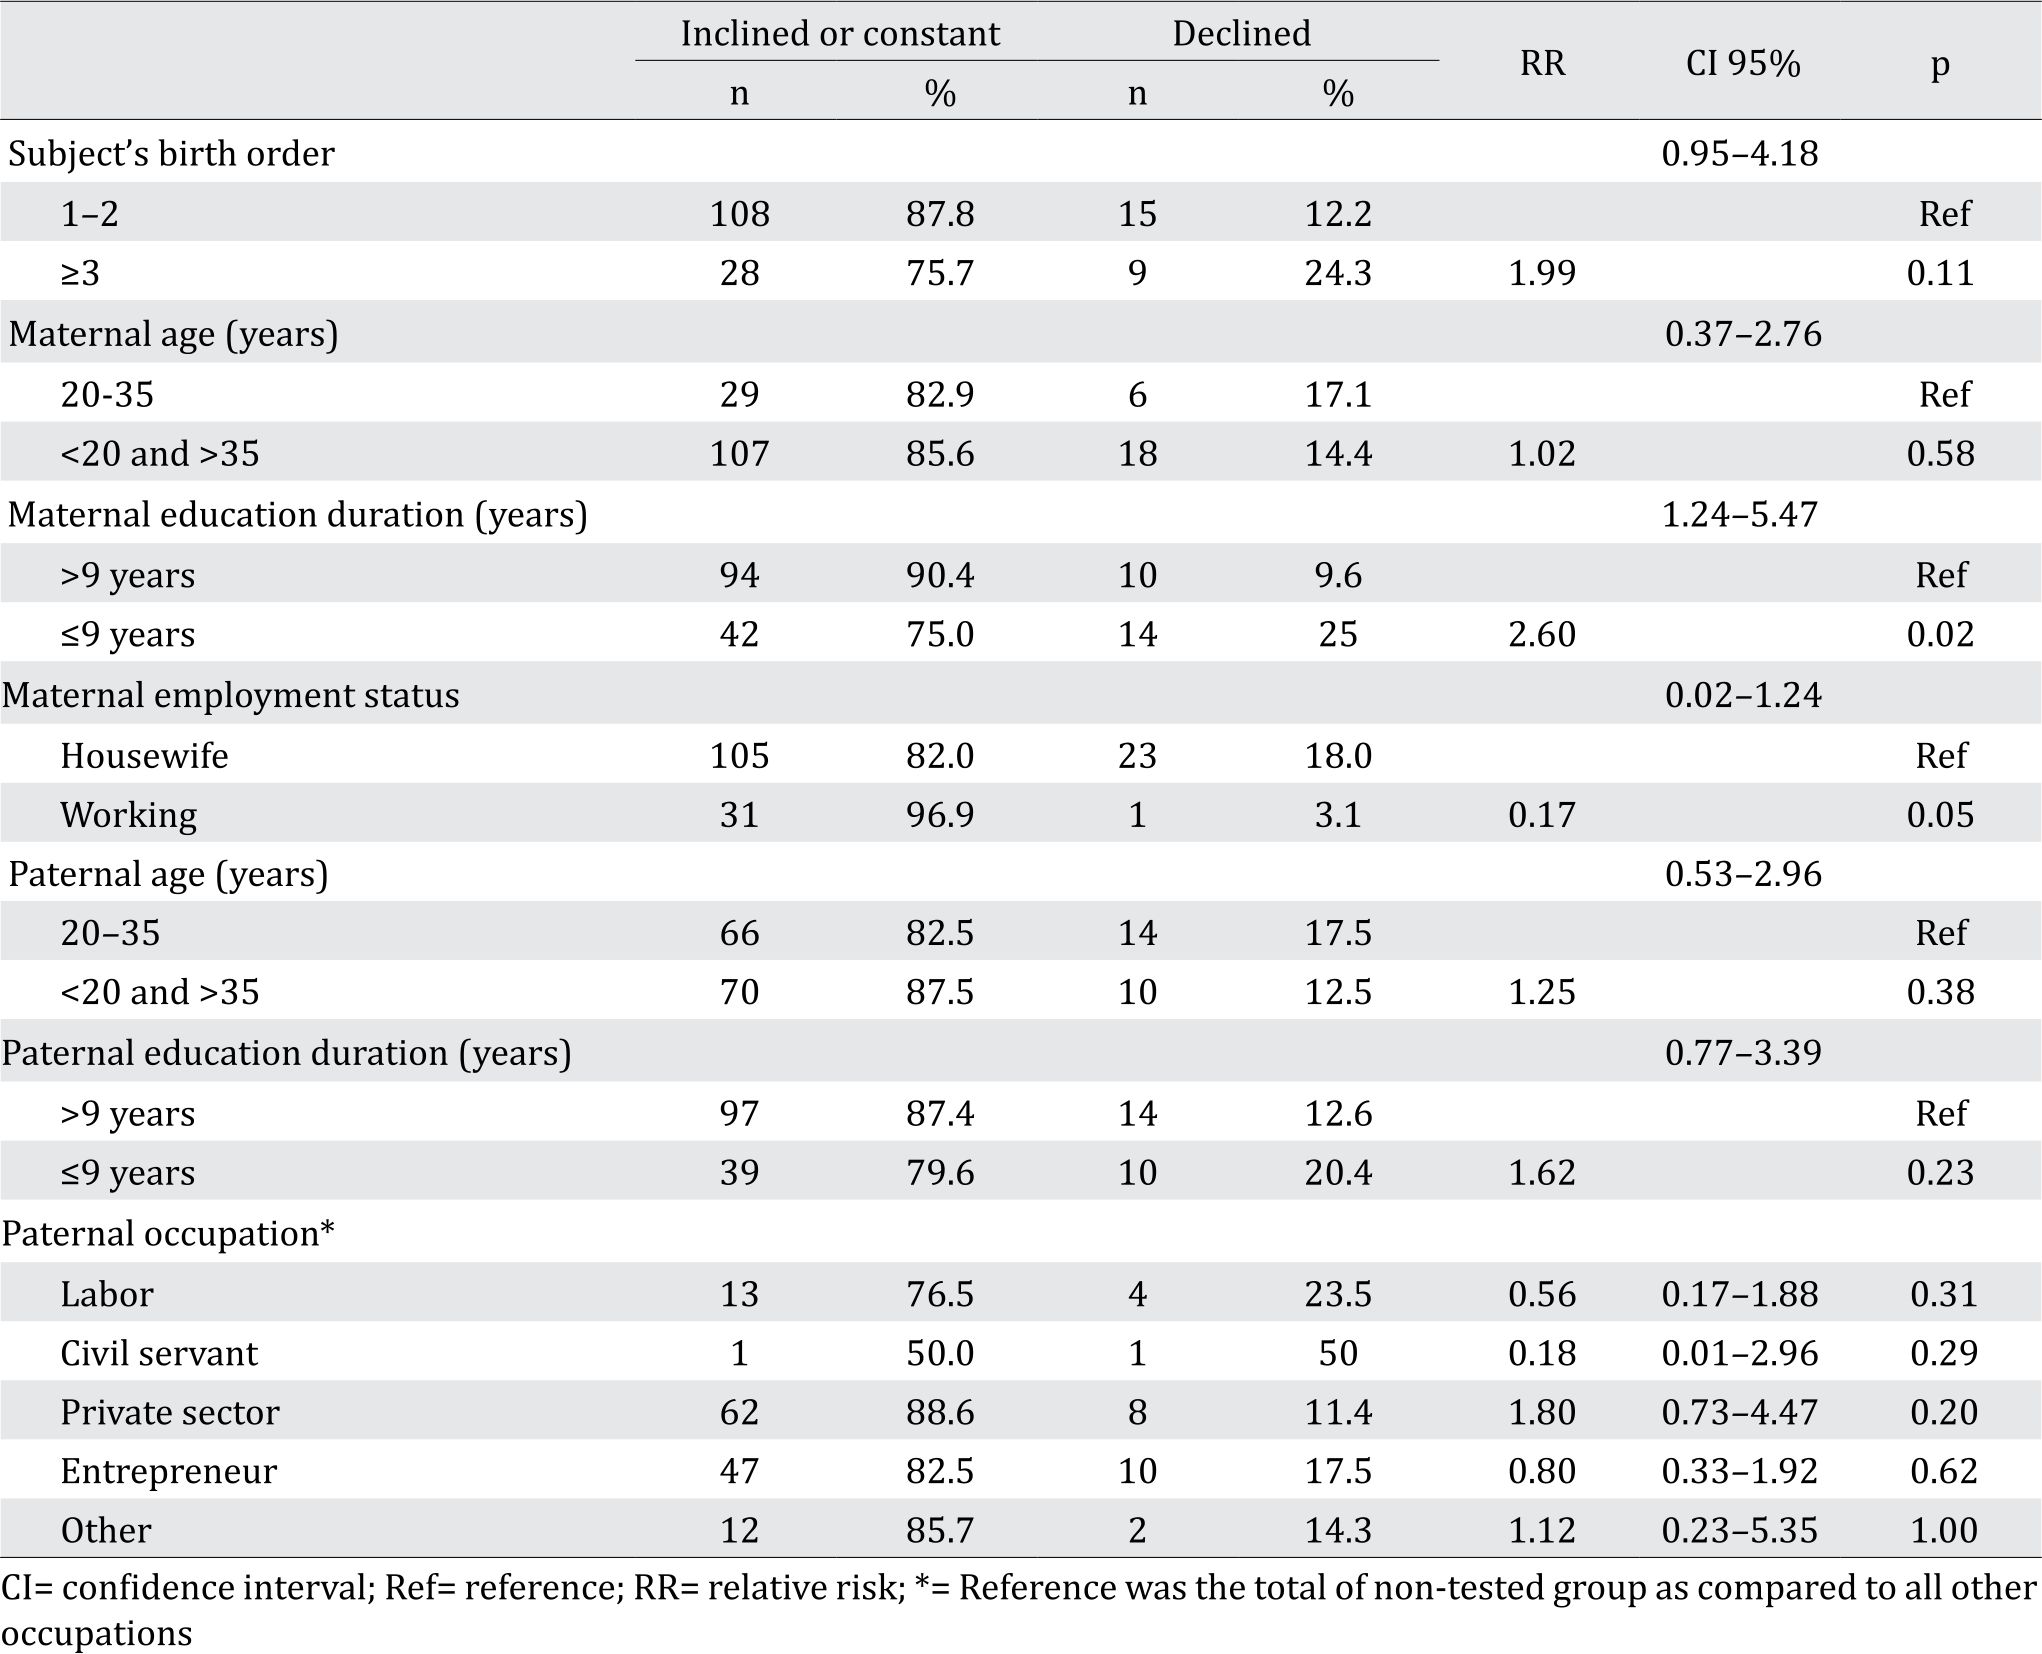
Birth order, maternal age, and paternal age were considered not associated significantly with children linear growth (p>0.05). Maternal education duration (RR=2.60, 95% CI=1.24– 5.47; p=0.02) showed statistically significant association with children linear growth. This meant that mother with education duration less than 9 years had 2.6 times higher risk of having children with declined linear growth than mother with education more than 9 years. Independent analysis of father employment status subgroups showed no statistical significant association with children linear growth.
DISCUSSION
Linear growth failure reflects the major public health problem caused by malnutrition. About 165 million of children under five years old were affected, and the highest was found in Southern Asia (56%) and Africa (36%).8 In this study, we found that 24 out of 160 (15%) subjects with declined linear growth, resulting in stunting and severe stunting. The stunting prevalence in this study was lower than stunting prevalence in Jakarta which was 27.5% as reported by the 2013 basic health survey.9 This difference might be due to better infant feeding practice, better nutritional intake or better socio-economic factors in our subjects which were not explored further as it was beyond the scope of this study.
In general, children growth is indicated by weight and length/height. Growth failure or failure to thrive was considered if a child’s weight is below the 5th percentile, if it drops down more than 2 major percentile lines, or if weight for height is less than 5th percentile.10 Since we studied the linear growth, we used length as the variable. The advantage of using length is a stable indicator and not influenced by acute condition such as dehydration and it represents long term growth.
Children growth often shifts percentiles for both length-for-age (LFA) and weight-for-age (WFA), especially in the first 6 months. However, majority of shifting is settling into a curve towards the 50th percentile rather than away.11 The shifting is regarded as normal as long as in normal range of –2 SD to +2 SD. If LFA fall to below -2SD from the median for LFA, the child can be classified as stunting according to the WHO multicenter growth reference study group.1 Majority of stunting occurred in the first 1,000 days or before 2 years old.12 Stunting before the age of 2 years old predicts poorer cognitive and educational outcomes in later childhood and adolescence13 and has significant educational and economic consequences at the individual, household, and community levels. Some catch up is possible in height-for-age after 24 months, with uncertain cognitive gains.14
About 24 subjects who had normal LFA at 6–11 weeks of age declined to stunted (14 subjects) and severely stunted (10 subjects) at 18–24 months of age. Changes in growth trajectory were associated with many factors. Several studies have found factors, such as child’s gender, age, birth order, parental education, and parental working status to be common determinants of stunting.15 Studies in Indonesian children reported that factors related to children stunting were lower birth weight, low parental height, low maternal education, higher family member, male sex, living in urban area and low sanitation.16, 17
There was no significant association between children birth order, maternal age, and maternal employment status variables with children linear growth in this study. Majority of the subjects 136 out of 160 (85%) had constant or inclined linear growth. From birth order, as many as 15 out of 24 children with declined linear growth were first- or second- born child. The poor association between maternal age and parity with linear growth was also found in a study in South Africa.18 However, in studies with large sample, there was association noted between birth order and children stunting. A study of 12,830 children in England reported that older mother was associated with higher body length, and higher parity was associated with risk of stunting.19 In a Bangladesh study, birth order was one of the significant predictors of children stunting. Third order, fourth order, and fifth or higher order children were 24%, 30%, and 72%, respectively, more likely to be stunted.20 This was possibly due to favoritism toward eldest sons, which affected parents’ fertility decisions and resource allocation across children.21 Birth order as a risk factor of children stunting was noted in studies with huge sample, in which a little difference of clinical characteristics may yield statistically significant result. This contradicting birth order result needs further study to shed light of the association.
Maternal education was correlated significantly with their children linear growth pattern. As much as 94 out of 104 (90.4%) mothers with education for more than 9 years had children with good linear growth in this study. On the other hand, 14 out of 24 (58.3%) subjects with declined linear growth had mothers with education duration less than 9 year. The higher the maternal level of education, the better the linear growth. This result was consistent with the study conducted in Indonesia, Bangladesh and Uruguay, which found that children whose mothers had higher education background had lower risk for stunting.15 Further study in Bangladesh had emphasized this association, in which study in prenatal to preadolescence period had shown strong association between maternal education and stunting in children.22 The high level of education increases the probability for the mother to provide quality care since prenatal and thus improved child’s nutritional intake.3 Maternal education was a strong determinant factor to children stunting.15
However, study results regarding the association of maternal employment status and linear growth are still conflicting. Some previous studies reported that housewife mothers could provide more favorable care for their child than working mothers, by giving more attention to the nutritional intake and maintain environment hygiene. The more time she spends working out of the house, the less time she has to ensure adequate nutritional intake and monitor the child’s activity.23 Working mothers may contribute to the higher family income and may further provide better nutrition for the child and hire caregiver who can take care of the children. On the other hand, working mothers may have less time to supervise their children and prepare their meals.23 Working mother may have protective impact to childhood stunting if the additional income gained is allocated for better nutrition for children, and mother substitute is available to take care the children.
Regarding paternal socio-demographic factors, there was no significant association between paternal age, education level, and occupation with children linear growth pattern. Fourteen out of 24 subjects who showed declined linear growth had father with more than 9 years of education while other 10 subjects had father with less than 9 years of education. Previous study in low-to-middleincome countries reported similar results which stated that maternal education had bigger impact to children linear growth compared to paternal education.24 This might be due to the traditional custom in developing countries such as Indonesia and Bangladesh where mother rearing practice and education level as the main caregiver would give stronger impact to the child than father rearing practice and education level. On the other hand, a large population study in Bangladesh and Indonesia showed that paternal education level was associated with children linear growth.15
As maternal education is an important risk factor of declined linear growth, ensuring appropriate education for future mothers is a crucial prevention strategy. Parents should encourage their daughters to finish high school before getting married in accordance to our national policy of 12-year compulsory education.25
We provided thorough perspective in this study as we looked for the association of children linear growth, not only with maternal sociodemographic factors, but also with the paternal socio-demographic factors. Also, studying as a cohort of term gestational age and normal birth weight children had given better understanding about the association of risk factors and declined linear growth in approximately 18-month span.
However, there were several limitations in this study such as limited number of participants. Our findings were based on bivariate analysis without adjustment for possible confounders. Other demographic and health data such as parental height, family income, family size, spacing between births, nutritional intake might cause confounding bias were not obtained as it was beyond our scope. There was also a 38% drop-out rate in our study even though this dropout was due to unpredictable natural disaster that resulted in loss of contact. This particular group from flooded area might reflect lower socioeconomic status therefore might cause a selection bias.
In conclusion, mother with education duration less than 9 years was the determining sociodemographic risk factor that contributed to decline linear growth in children age less than 2 years. This finding should be promoted to parents who would encourage their daughters to finish high school before getting married in order to decrease stunting prevalence, improve cognitive and academic achievement of their children in the future.
Conflicts of Interest
The authors affirm no conflict of interest in this study.
Acknowledgment
We gratefully acknowledge all the subjects and their parents who were willing to participate in our study. We also acknowledge our site teams in Jatinegara, Mampang, and Tebet Health Centers who gave us full support to our study.
REFERENCES
- WHO. [Internet]. Interpreting growth indicators. In: Training course on child growth assessment. World Health Organization: Geneva; 2008. [cited : 2017 May 26th]. Available in: http://www.who.int /childgrowth/ training /module_c_interpreting_indicators.pdf?ua=1.
- Dewey KG, Begum K. Long‐term consequences of stunting in early life. Matern Child Nutr. 2011;7:5–18.
- Bloem MW, de Pee S, Hop LT, Khan NC, Laillou A, Minarto, et al. Key strategies to further reduce stunting in Southeast Asia: Lessons from the ASEAN countries workshop. Food Nutr Bull. 2013;34:S8–S16.
- Black RE, Victora CG, Walker SP, Bhutta ZA, Christian P, de Onis M, et al. Maternal and child undernutrition and overweight in low-income and middle-income countries. Lancet. 2013;382(9890):427–51.
- Nasikhak R, Margawati A. Faktor risiko kejadian stunting pada balita 24-36 bulan di Kecamatan Semarang Timur. Tesis. Program Studi Ilmu Gizi Fakultas Kedokteran Universitas Diponegoro, Semarang. 2012. Indonesian.
- Handayani F, Siagian A, Aritonang EY. Mother’s Education as A Determinant of Stunting among Children of Age 24 to 59 Months in North Sumatera Province of Indonesia. J Hum Soc Sci. 2017;22:58–64.
- Anisa P. Faktor-faktor yang berhubungan dengan kejadian stunting pada balita usia 25–60 bulan di Kelurahan Kalibaru Depok 2012. Thesis. Nutrition Study Program. Community Health Nutrition. Community Health Centre University of Indonesia. Indonesian.
- Kramer CV, Allen S. Malnutrition in developing countries. J Paediatr Child Health. 2015;25:422–7.
- Ministry of Health Republic of Indonesia. Basic Health Survey Report 2013. Jakarta: Ministry of Health; 2013.
- Keane VA. Chapter 15: Assessment of growth. In: Nelson Textbook of Pediatrics, 20th Edition. Philadelphia: Elsevier; 2016. p. 84–9.
- The Royal Children Hospital Melbourne. [Internet]. Child growth and growth charts in the early years. 2013. [cited 2017 May 30th]. Available in: http://www.rch.org. au/uploadedFiles/Main/Content/childgrowth/DoHA_ backgroundreading_April2013.pdf.
- Prendergast AJ, Humphrey JH. The stunting syndrome in developing countries. Paedatr Int Child Health. 2014;34:250–65.
- Walker SP, Chang SM, Powell CA, Simonoff E, Grantham- McGregor SM. Early childhood stunting is associated with poor psychological functioning in late adolescence and effects are reduced by psychosocial stimulation. J Nutr. 2007;137:2464–9.
- Casale D, Desmond C. Recovery from stunting and cognitive outcomes in young children: Evidence from the South African birth to twenty cohort study. J Dev Orig Health Dis. 2016;7:163–71.
- Semba RD, de Pee S, Sun K, Sari M, Akhter N, Bloem MW. Effect of parental formal education on risk of child stunting in Indonesia and Bangladesh: A cross-sectional study. Lancet. 2008;371:322–8.
- Rachmi CN, Agho KE, Li M, Baur LA. Stunting, underweight and overweight in children aged 2.0-4.9 years in Indonesia: prevalence trends and associated risk factors. PLoS One. 2016;11:e0154756.
- Yasmin G. Kustiyah L, Dwiriani CM. Risk factors of stunting among school – aged children from eight provinces in Indonesia. Pakistan J Nutr. 2014;13:557–66.
- Willey BA, Cameron N, Norris SA, Pettifor JM, Griffiths PL. Socio-economic predictors of stunting in preschool children: a population-based study from Johannesburg and Soweto. S Afr Med J. 2009;99:450–6.
- Galobardes B, McCormack VA, McCarron P, Howe LD, Lynch J, Lawlor DA, et al. Social inequalities in height: persisting differences today depend upon height of the parents. PLoS One. 2012;7:e29118.
- Rahman M. Association between order of birth and chronic malnutrition of children: a study of nationally representative Bangladeshi sample. Cad Saude Publica. 2016;32:e00011215.
- Jayachandran S, Pande R. [Internet]. Why are Indian children so short? The role of birth order and son preference. National Buraeu of Economic Research Working Paper No. 21036, 2015. [cited 2016 December 12th]. Available in: www.nber.org/papers/w21036.pdf.
- Svefors P, Rahman A, Ekström E-C, Khan AI, Lindström E, Persson LÅ, et al. Stunted at 10 Years. Linear growth trajectories and stunting from birth to preadolescence in a rural Bangladeshi cohort. PloS One. 2016;11:e0149700.
- Sulthan S. Prevalence of stunting and thinness among school-age children of working and non-working mothers in rural areas of Aligarh District. Int J Appl Basic Med Res. 2014;3:51–7.
- Vollmer S, Bommer C, Krishna A, Harttgen K, Subramanian SV. The association of parental education with childhood undernutrition in low- and middleincome countries: Comparing the role of paternal and maternal education. Int J Epidemiol. 2017;46:312–23.
- Indonesian Ministry of Education and Culture. [Internet]. Indonesian Ministry of Education and Culture Regulation Number 12 Year 2015 on Smart Indonesia. [cited 2017 January 30th] Available in:http:// dinustek.com/demoapp/disdiksmg/content/image/ files/PERMENDIKBUD%20No%2012%20tahun%20 2015%20ttg%20Program%20Indonesia%20Pintar. pdf.
Copyright @ 2017 Authors. This is an open access article distributed under the terms of the Creative Commons Attribution-NonCommercial 4.0 International License (http://creativecommons.org/licenses/by-nc/4.0/), which permits unrestricted non-commercial use, distribution, and reproduction in any medium, provided the original author and source are properly cited.
mji.ui.ac.id